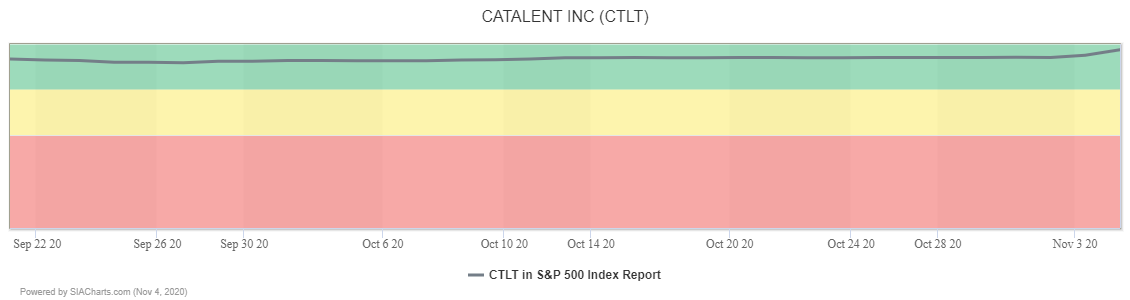
Catalent Inc. (CTLT), a pharmaceutical company, has been climbing within the Green Favored Zone of the SIA S&P 500 Index Report since it joined the Index in September. In the last month, the shares have moved up 30 spots to 21st place.
Back in the spring Catalent (CTLT) shares had staged a major rally from near $30.00 to up above $90.00. Since July, upward momentum faded and the shares settled into a $80.00 to $95.00 consolidation range. This week, accumulation has resumed in earnest with the shares driving up off of a higher low near $88.00, blasting through the $95.00 top of the previous channel (which now reverses polarity to become support) and continuing with a break through of the $100.00 round number barrier. Measured moves indicate next potential resistance tests on trend appear near $110.00 then $125.00.

Coming off of a big two pole recovery rally between March and May, Catalent (CTLT) shares have remained under accumulation. Since July, the shares have completed a series of bullish patterns, including a Triple Top and then two Double Tops. The current breakout over $95.00 and then $100.00 to a new all-time high, signals that a new upleg has commenced.
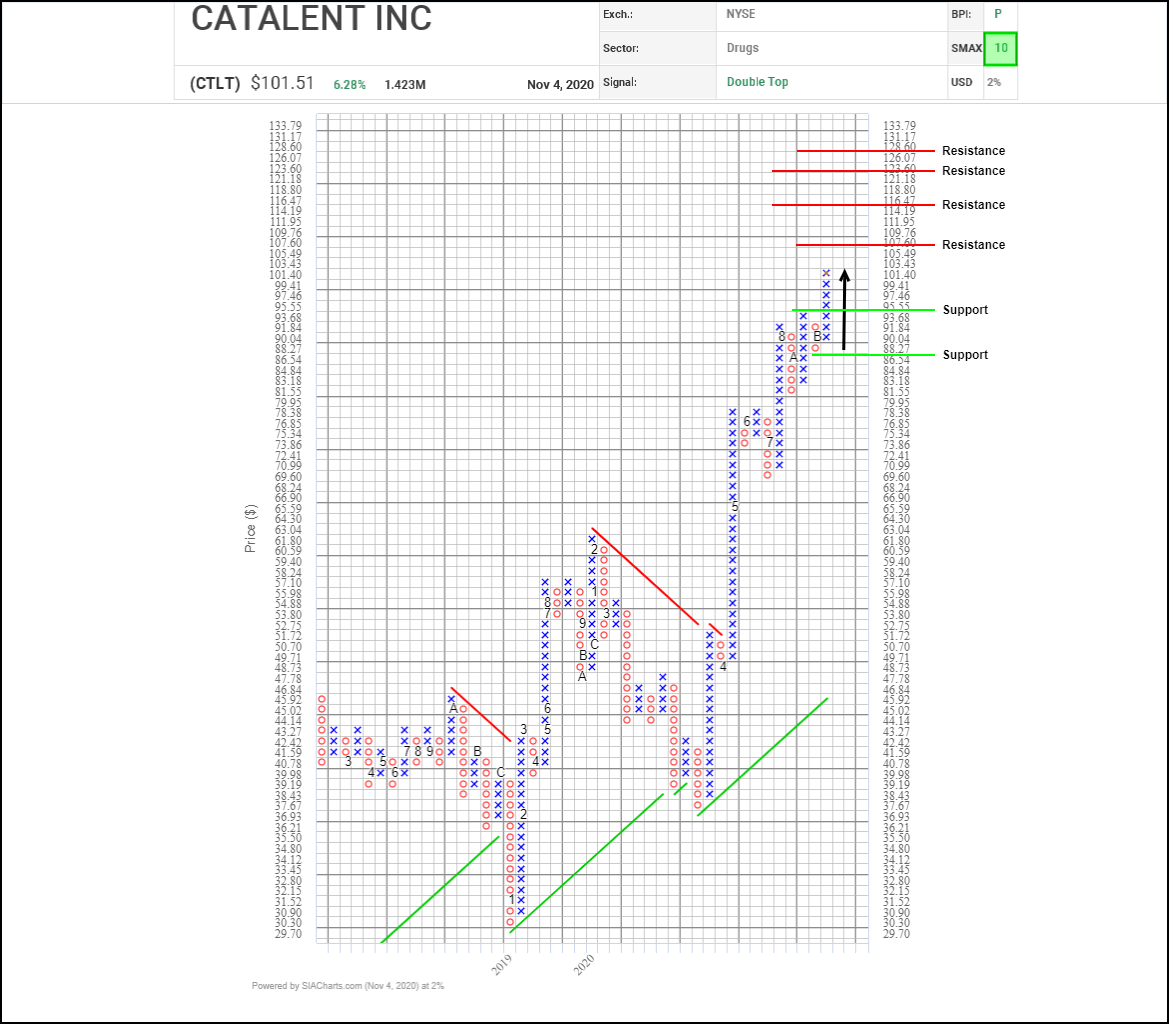
A series of horizontal and vertical counts suggest potential upside resistance tests on trend near $107.60, $116.45, $123.60 and $128.60. Initial support appears near $93.70 based on a 3-box reversal and a retest of the recent breakout point.
With its bullish SMAX score increasing to a perfect 10, CTLT is exhibiting near-term strength across the asset classes.
Disclaimer: SIACharts Inc. specifically represents that it does not give investment advice or advocate the purchase or sale of any security or investment whatsoever. This information has been prepared without regard to any particular investors investment objectives, financial situation, and needs. None of the information contained in this document constitutes an offer to sell or the solicitation of an offer to buy any security or other investment or an offer to provide investment services of any kind. As such, advisors and their clients should not act on any recommendation (express or implied) or information in this report without obtaining specific advice in relation to their accounts and should not rely on information herein as the primary basis for their investment decisions. Information contained herein is based on data obtained from recognized statistical services, issuer reports or communications, or other sources, believed to be reliable. SIACharts Inc. nor its third party content providers make any representations or warranties or take any responsibility as to the accuracy or completeness of any recommendation or information contained herein and shall not be liable for any errors, inaccuracies or delays in content, or for any actions taken in reliance thereon. Any statements nonfactual in nature constitute only current opinions, which are subject to change without notice.