
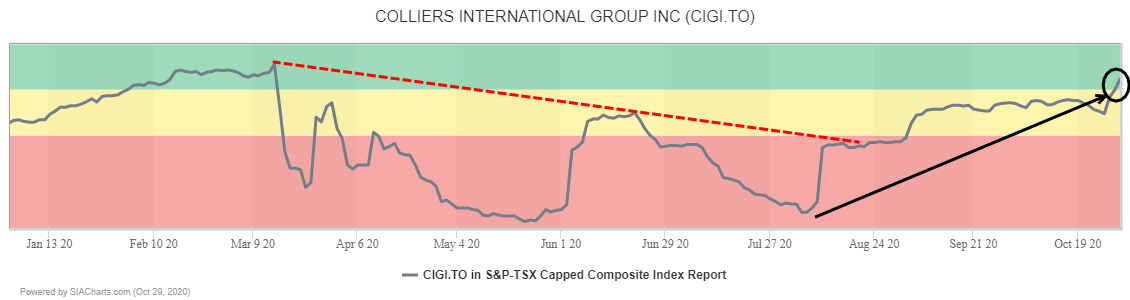
Real Estate brokerage Colliers International (CIGI.TO) returned to the Green Favored Zone of the SIA S&P/TSX Composite Index Report yesterday for the first time since March after moving up 13 spots yesterday and 39 spots in the last week.
For the last seven months, Colliers International (CIGI.TO) shares have been steadily recovering lost ground. While a trend of higher lows indicated continuing accumulation, the shares had struggled with resistance at the $90.00 level. This week, the shares have broken through the $90.00 barrier, completing a bullish Ascending Triangle base and signaling the start of a new advance.
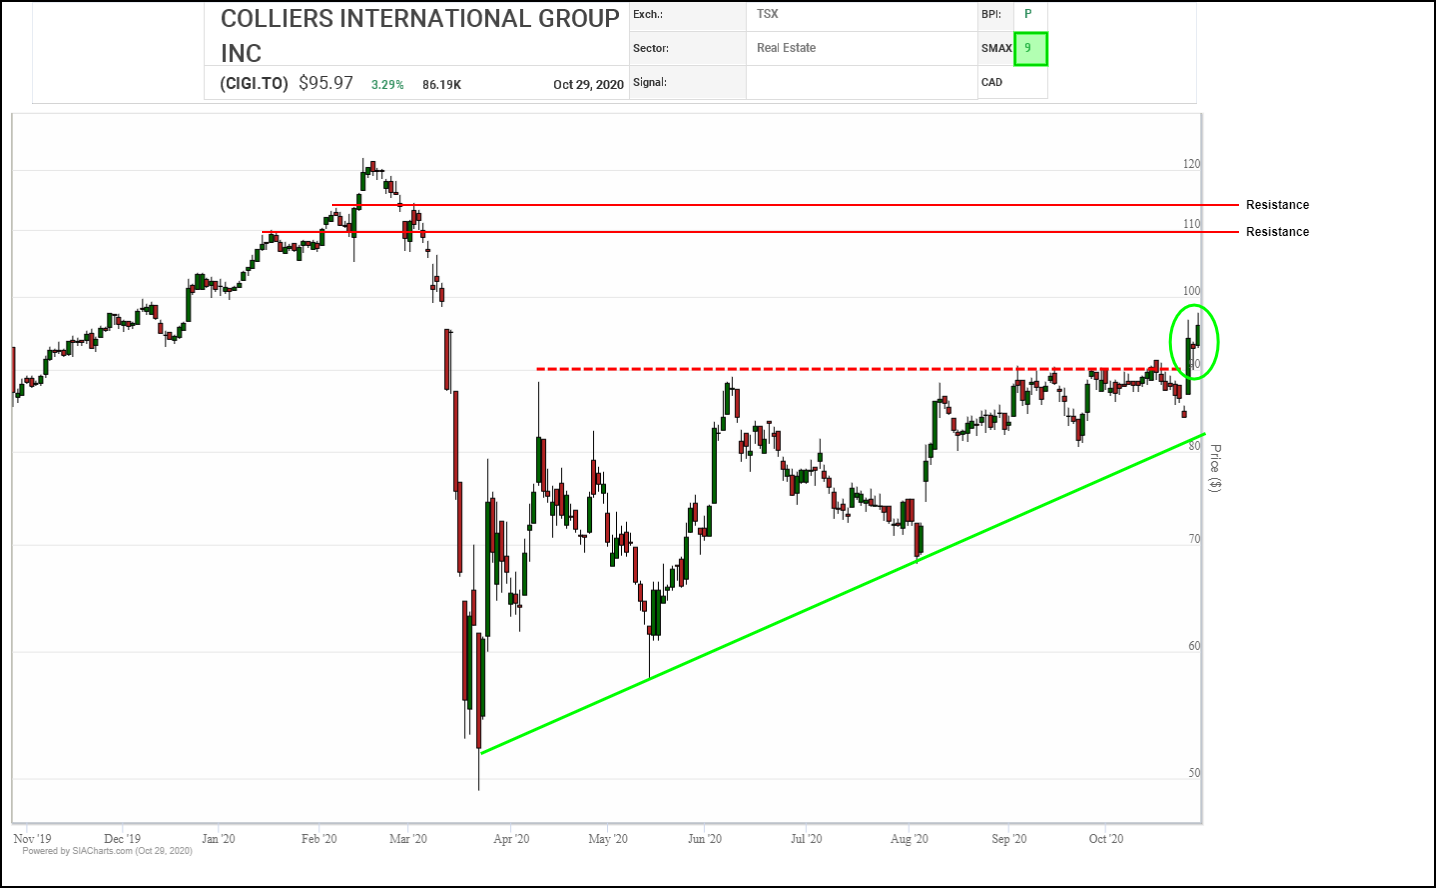
Initial upside resistance may appear near the $100.00 round number which is also near the top of an old gap, followed by the $110.00 to $112.50 area where a measured move converges with shoulder resistance from a previous head and shoulders top and then the $120.00 to $122.50 area where another measured move converges with the previous peak. Initial support moves up toward $92.50 from the recent $90.00 breakout point.
A major technical breakout is underway in Colliers International (CIGI.TO) shares. Rallying up through $90.50 snapped a downtrend line, cleared a round number hurdle and completed a bullish Triple Top pattern, all combining to signal the start of a new advance.
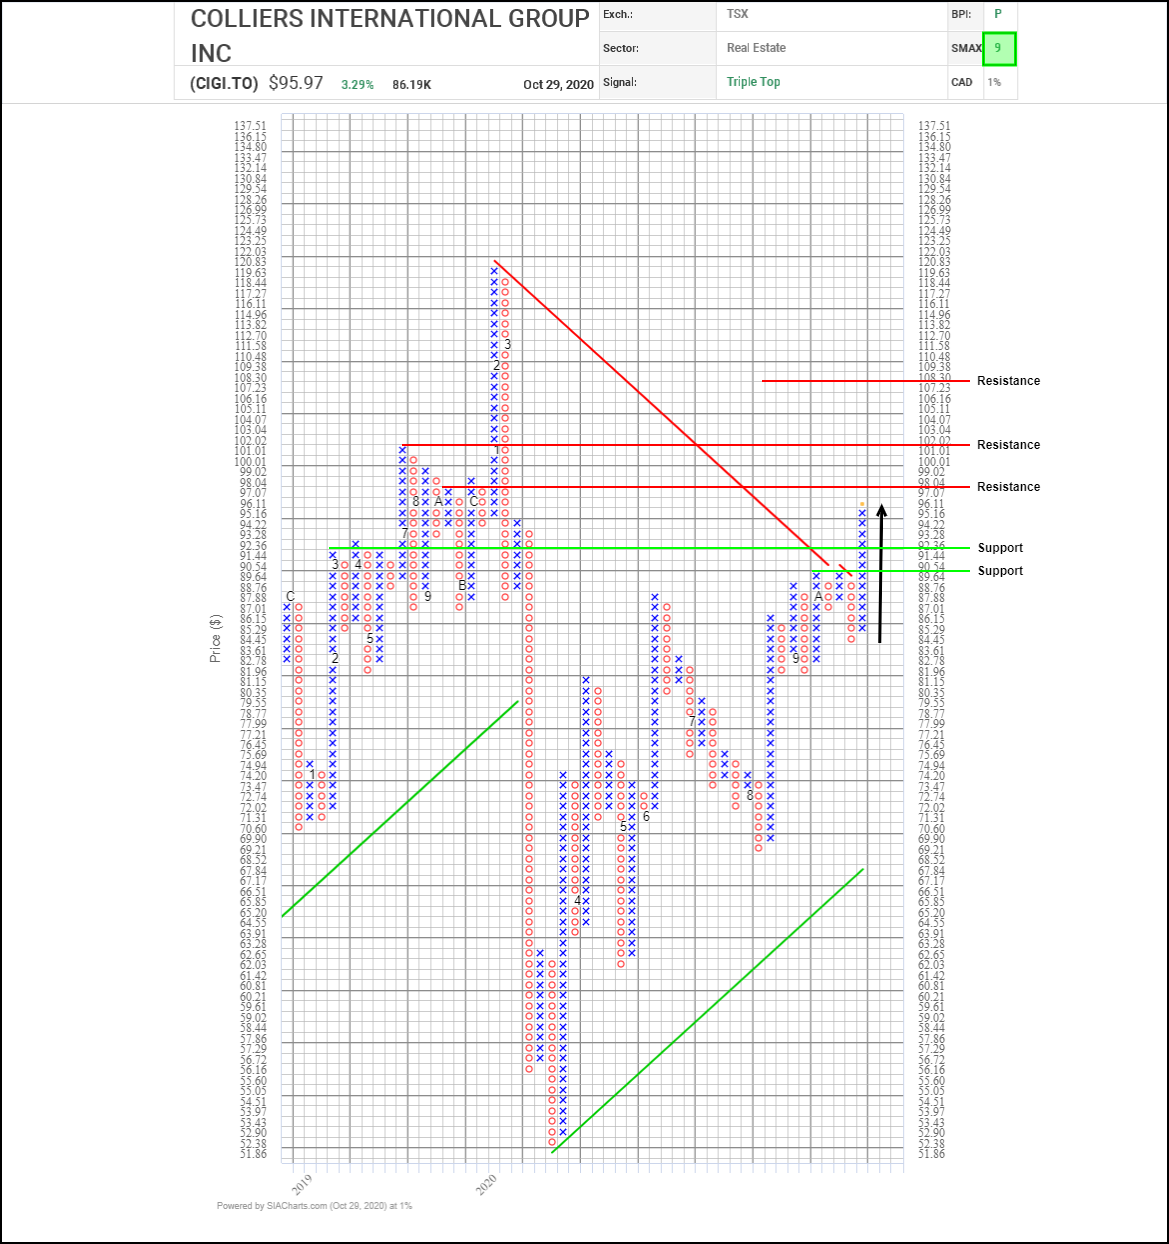
Potential upside resistance tests on trend appear near $98.05 based on a horizontal count, the $100.00 round number, a previous column high near $102.00 and then $108.30 based on a vertical count. Initial support appears near $91.45 based on a 3-box reversal.
With a bullish SMAX score of 9, CIGI is exhibiting near-term strength against the asset classes.
Disclaimer: SIACharts Inc. specifically represents that it does not give investment advice or advocate the purchase or sale of any security or investment whatsoever. This information has been prepared without regard to any particular investors investment objectives, financial situation, and needs. None of the information contained in this document constitutes an offer to sell or the solicitation of an offer to buy any security or other investment or an offer to provide investment services of any kind. As such, advisors and their clients should not act on any recommendation (express or implied) or information in this report without obtaining specific advice in relation to their accounts and should not rely on information herein as the primary basis for their investment decisions. Information contained herein is based on data obtained from recognized statistical services, issuer reports or communications, or other sources, believed to be reliable. SIACharts Inc. nor its third party content providers make any representations or warranties or take any responsibility as to the accuracy or completeness of any recommendation or information contained herein and shall not be liable for any errors, inaccuracies or delays in content, or for any actions taken in reliance thereon. Any statements nonfactual in nature constitute only current opinions, which are subject to change without notice.