by Don Vialoux, EquityClock.com
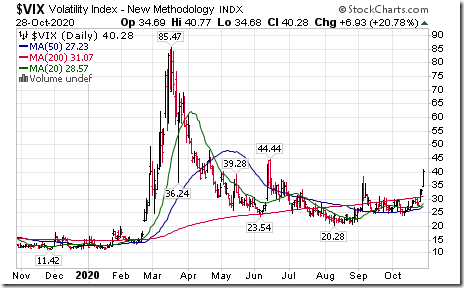
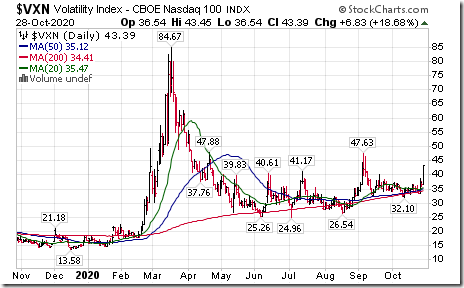
A Good Day for Volatility
The VIX spiked. So did VXN
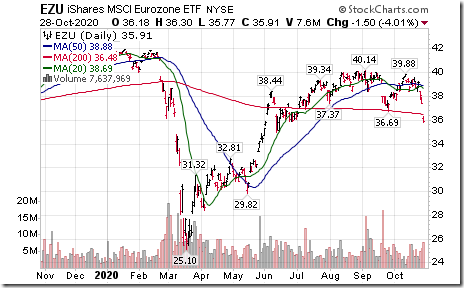
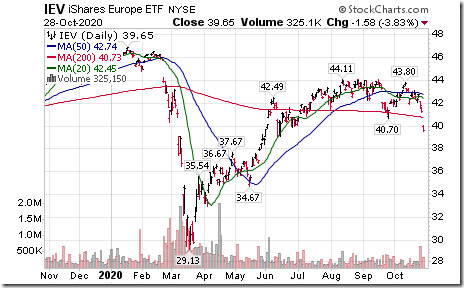
A Bad Day for Equity Markets Around The World
Weakness in equity markets first appeared in Europe when France and Germany announced additional shut downs of public services due to COVID 19.
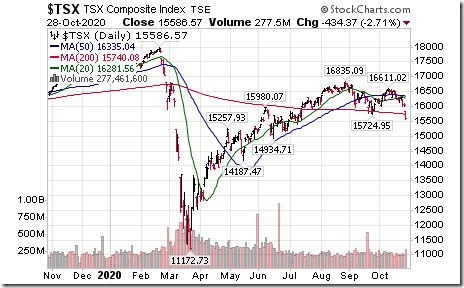
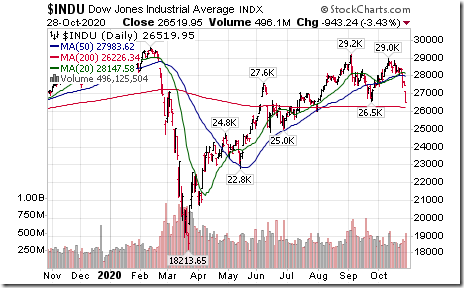
Weakness quickly spilled into North American equity markets. The Dow Jones Industrial Average and TSX Composite Index moved below intermediate support and completed double top patterns.
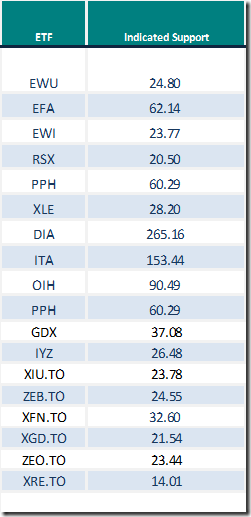
Exchange Traded Funds that broke intermediate support included the following:
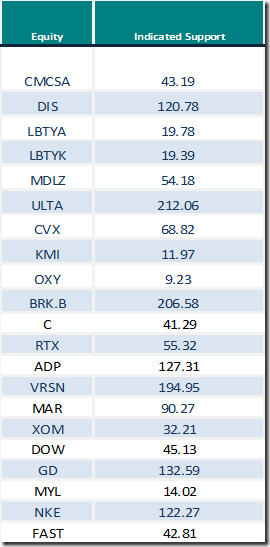
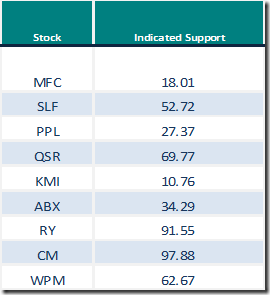
U.S. equities in the S&P 100 Index and NASDAQ 100 Index that broke intermediate support
Canadian equities in the TSX 60 Index that broke intermediate support
Trader’s Corner
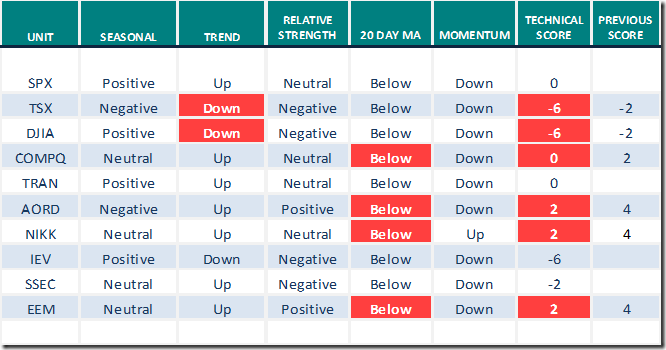
Equity Indices and Related ETFs
Daily Seasonal/Technical Equity Trends for October 28th 2020
Green: Increase from previous day
Red: Decrease from previous day
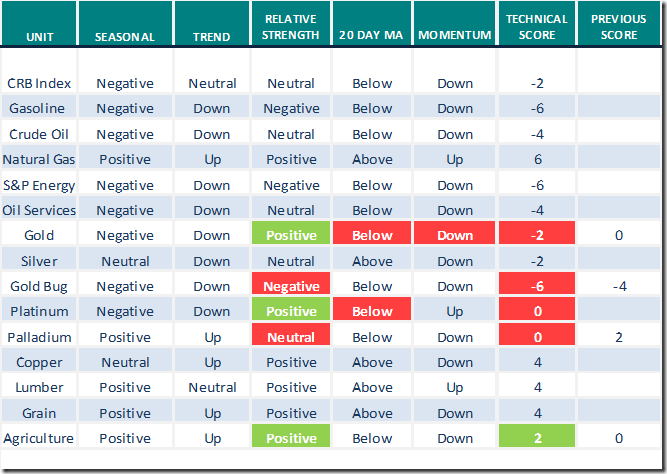
Commodities
Daily Seasonal/Technical Commodities Trends for October 28th 2020
Green: Increase from previous day
Red: Decrease from previous day
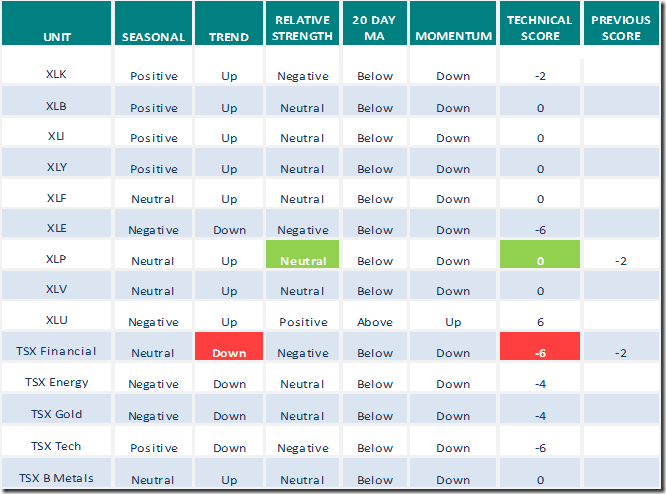
Sectors
Daily Seasonal/Technical Sector Trends for October 28th 2020
Green: Increase from previous day
Red: Decrease from previous day
Schachter’s Eye On Energy
As Josef predicted, the energy complex on both sides of the border remains under technical pressure. Additional weakness in the sector is anticipated. Also, watch for an important intermediate low near the end of the year. Below is an updated comment from Josef
Energy Stock Market:
The S&P/TSX Energy Index has fallen from the June high at 96.07 to the current level today of 63.87 (last week it was at 65.85). Overall the index is now down by 34% in under four months. We see much more downside over the coming months as unfavourable Q3/20 results impact the stocks even more. We will be watching to see how companies discuss their debt loads and lender support. Companies with pessimistic views about their reserve base lending, cutbacks in lines of credit and potential additional impairment write-downs will face significant stock price pressure. The next support for the S&P/TSX Energy Index is at 60.38 (the low four weeks ago). Further lows are likely in Q4/20 as tax loss selling is likely to be very nasty this year. We see the likelihood that the final low for the index could be in the 32-36 area during tax loss selling season. We expect to see a very attractive BUY signal generated during Q4/20 and will recommend new ideas as well as highlight our favourite Table Pounding BUYS which should trade at much lower levels than now.
Please become subscribers before the November 26th webinar as we will be discussing the best ideas to invest in during the tax loss selling season. In addition during the 90 minute webinar we will discuss the third quarter results (those that did well and those that did not perform) of the 27 companies we cover.
Subscribe to the Schachter Energy Report and receive access to our two monthly reports, all archived Webinars, Action Alerts, TOP PICK recommendations when the next BUY signal occurs, as well as our Quality Scoring System review of the 27 companies that we cover. We go over the markets in much more detail and highlight individual companies in our reports. If you are interested in the energy industry this should be of interest to you.
Tomorrow we will release our October Monthly SER and we cover the general stock market’s erosion and downside risk. As well we review the only company that reported Q3/20 results before our research cut-off of Friday November 20th. The company was an energy service company that reported EBITDA ahead of our forecast and showed an improvement in their balance sheet during these tough times for the energy service sector.
To get access to our research go to https://bit.ly/2FRrp6k to subscribe.
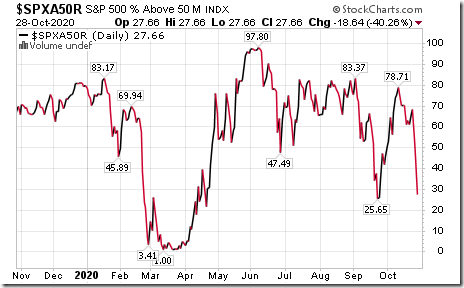
S&P 500 Momentum Barometer
The Barometer plunged 18.64 to 27.66 yesterday. It changed from intermediate neutral to intermediate oversold on a move below 40.00. Trend remains down.
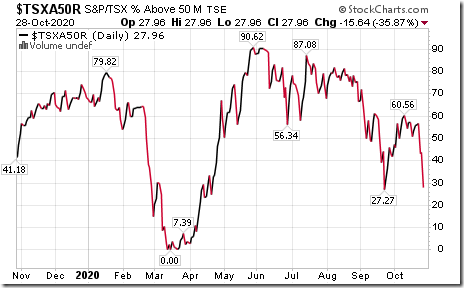
TSX Momentum Barometer
The Barometer plunged 15.64 to 27.96 yesterday. It changed from intermediate neutral to intermediate down on a move below 40.00. Trend remains down.
Disclaimer: Seasonality and technical ratings offered in this report and at
www.equityclock.com are for information only. They should not be considered as advice to purchase or to sell mentioned securities. Data offered in this report is believed to be accurate, but is not guaranteed
This post was originally publised at Vialoux's Tech Talk.


