
After a decade of underperformance by value stocks, even the biggest supporters are starting to lose faith. Should they?
by Daniel Phillips, Director, Asset Allocation Strategy, Northern Trust
Value stocks have a long history of support from academics and practitioners alike — for both theoretical and empirical reasons. But after a decade of underperformance, even the biggest supporters are starting to question their faith. Should they? Has the “new” economy changed things forever? Or is there still life in a factor that has shown aggregate outperformance for nearly a century?
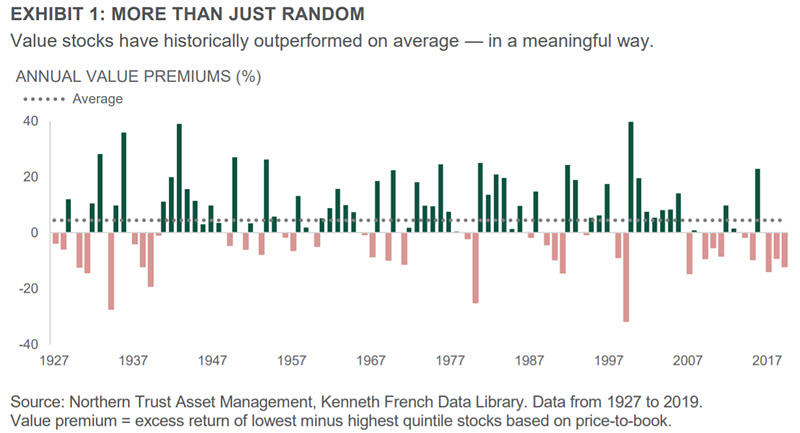
The value factor — a collection of stocks that are the least expensive based on various valuation metrics (price/book, price/earnings, price/cash flow, etc.) — has provided a long-term return premium going back nearly 100 years (see Exhibit 1). However, the factor has been in a long period (over a decade) of underperformance. This has caused increased skepticism that the value premium can “work” in the new economy we live in — where interest rates are low, inflation is stuck and growth stocks (specifically technology stocks) seem to have an infinite runway. On the last point, we observe the late 1990s/early 2000s, where there was a similar, though shorter, period of value underperformance. Value then went on to materially outperform for seven years straight. That said, the profitability of tech sector names combined with low interest rates and Stuckflation — and the impact the “new economy” has on the value factor — represent a different backdrop today.
We provide the background of the value factor; our view on what has been driving recent underperformance; what catalysts may reverse value’s fortunes; and what can be done within value strategies while we wait for this reversal to occur.
Why Value Anyway?
Value stocks have shown a statistically-significant return premium over growth stocks based on data going back to 1926. The value premium was formally identified by Eugene Fama and Kenneth French in their 1992 seminal paper, The Cross-Section of Expected Stock Returns. However, the concept of value investing goes at least as far back to Benjamin Graham’s book The Intelligent Investor, published in 1949 and further discussed in Seth Klarman’s 1991 cult-classic, Margin of Safety (the book, now out of print, has been valued at over $1,000 on the likes of eBay and Amazon). As such, even before Fama-French did the empirical work, it was well-understood that less expensive stocks tended to show better returns over time.
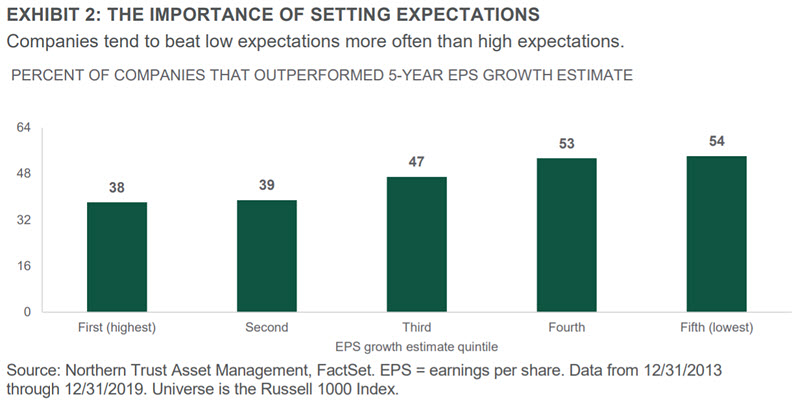
There is a heated debate as to why the value premium exists. Proponents of the efficient market hypothesis (EMH) — the concept that markets quickly and efficiently price in all known information into equity prices — argue that value stocks are cheaper because they are riskier. And that the lower valuation is necessary compensation for the higher risk being assumed. Conversely, those who believe in behavioral finance dismiss major elements of EMH. Instead, they argue that near-term market inefficiencies lead to market anomalies, where prices do not reflect the economic value of a stock or groups of stock, and the value premium is one such anomaly. They go on to claim that there is no evidence to support the notion that value stocks are inherently more risky. Rather, they argue that growth stocks underperform because investors assign overly aggressive expectations to high-flying companies that are difficult to live up to. Providing some evidence of this theory, we sorted Russell 1000 Index companies by their five-year growth expectations, bucketed into quintiles. As seen in Exhibit 2, the top quintile (highest growth expectation) stocks only beat those lofty expectations 38% of the time. Meanwhile, the fifth quintile stocks beat relatively low expectations 54% of the time. Notably, this study looks at the 2013-2019 period, wherein many growth (specifically tech) stocks’ earnings potential has been under-appreciated.
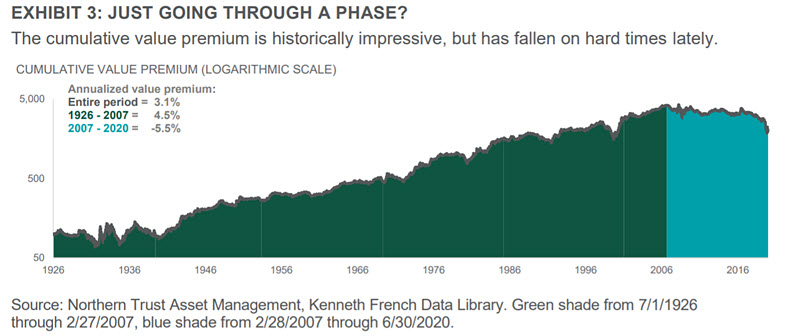
The above debate has raged for decades. While reasonable minds can disagree, our quantitative research team leans more towards value being an anomaly. However, regardless of why it exists, investing in value stocks has been a profitable investment strategy for nearly 100 years. As seen in Exhibit 3 on the next page, the annualized value premium (defined as the 20% most inexpensive stocks less the 20% most expensive stocks – as determined by price-to-book value) has equaled 3.1% since 1926 (through 6/30/2020). However, getting under the hood of that full time series, we have seen weakness more recently. Up until early 2007, the long-term annualized value premium was an even more impressive 4.5%. But since then, the value premium has actually been a value discount — a -5.5% return annually from 2/28/2007 through 6/30/2020. This fairly constant underperformance has led to skepticism around the value factor as a viable investment strategy going forward. Despite this recent and notable underperformance, we don’t think now is the time to lose faith.
So What’s Been Going on Lately?
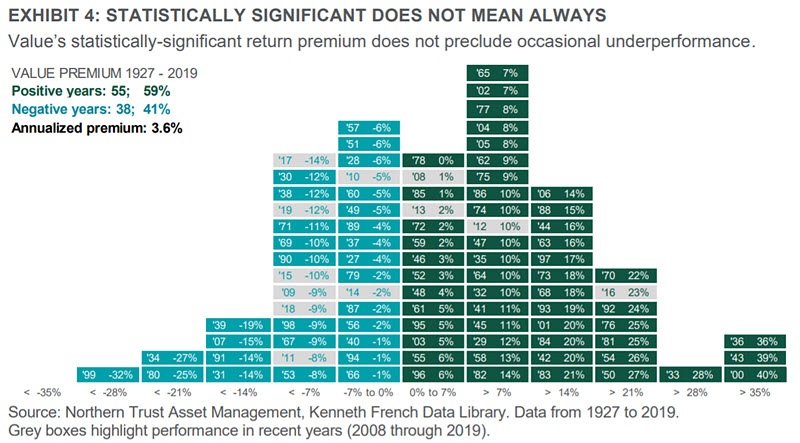
When analyzing value’s recent underperformance, we find both statistical (simple variation around the mean) and fundamental culprits. First, let’s do a quick stats 101 review. Value is a factor because its return premium is “statistically significant” — a stats term that means, in this case, there is a 95% (or greater) probability that the value factor is “real” and is not just a random outcome. The problem is that investors tend to place too much confidence on “statistically-significant” data, especially in any given time period. The reality is that the “statistically-significant” value premium has only outperformed 59% of the years going back to 1927. Exhibit 4 shows the histogram of the annual outcomes for the value factor with the past 12 full years (2008-2019) highlighted in grey. To be clear, this is still meaningful, but it also means that the value factor can underperform, and, in fact, has underperformed 41% of the time.
To provide broader context, the market factor — the equity market return less the risk-free rate (three-month T-bill return) — outperforms 69% of the time and has provided a 6.4% return premium with a 19.8% standard deviation. Investors place a great deal of confidence in the market premium — as they should. But, in the same vein, they should also be somewhat confident in the long-term efficacy of the value factor (at least from a statistical point of view). The value premium has a lower hit rate (59% vs. 69%) and a smaller premium (3.6% vs. 6.4%), but the standard deviation of the value premium is also lower (13.3% vs. 19.8%). This means less dispersion around that 3.6% annualized value premium. Note that the 3.6% value premium we cite in Exhibit 4 is different than the 3.1% premium from Exhibit 3 because of slightly different time frames.
Many investors (especially the statistically-inclined) will accept the above. But they will also note that we have seen persistent underperformance in the last 12 years. Of the last 12 years (again, shown in grey in Exhibit 4), only four times has it been positive (a 33% hit rate). Further, 2020 will most likely be the fourth year in a row of value underperformance (year-to-date through 6/30, the value factor has returned -32%). Is value no longer the factor it once was?
We have identified two key trends that may be fundamentally impairing the value factor, both of which we attempt to remedy in our value strategies as we discuss starting on page six. The first trend is the failure of price-to-book — the main valuation metric used to define value (and which was never appropriate for all sectors anyway) — to keep up with the new economy. Specifically, price-to-book suffers from its accounting of intangible assets. Acquired intangible assets (e.g., goodwill) are generally overstated on the balance sheet whereas “organic” intangible assets (e.g., intellectual property) are generally understated. The latter are just as valuable as the former. Related, research and development (R&D) — the driving force of “organic” intangible assets — has grown materially as a percent of capital expenditures over recent decades (see Exhibit 5).
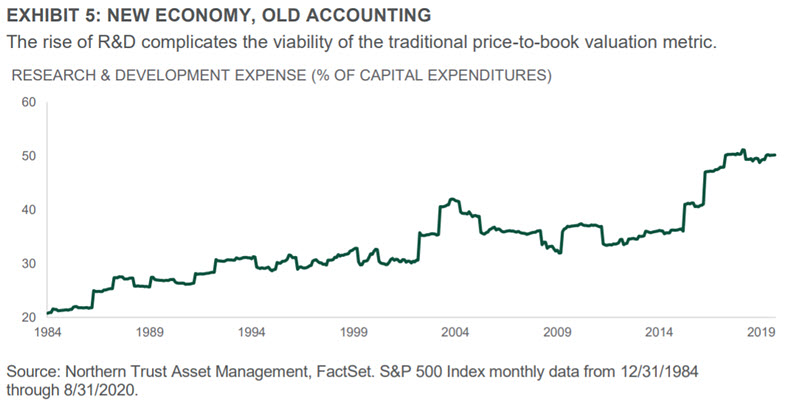
This is a challenge for price-to-book valuations because the “R” (and “D” in many cases) in R&D is expensed (not capitalized and depreciated over time). As such, the resulting “organic” intangibles aren’t accurately included in book value — both of which make those stocks with significant amounts of each look much more expensive than they really are. This is especially true in the new economy, where the fruits of R&D can be extremely valuable. Take, for example, Google. They don’t own a great deal of physical assets; instead their R&D contributes substantially to their future earnings prospects and overall value — but that R&D is understated in a price-to-book valuation metric. Other tech companies (and other sectors, such as healthcare) are also notably impacted.
The above conspires with the second trend we have been seeing, which is the notable outperformance of the technology and related sectors. Investors assigned high expectations for technology stock growth, but technology stocks have been meeting/outpacing lofty expectations in recent years (Amazon and its 55x price-to-forward-earnings valuation being the poster child). The result is that the Russell 1000 technology sector has outperformed the broader Russell 1000 by 21% year-to-date and 12% annually over the previous five years. This is important because technology stocks also happen to dominate the traditional growth indexes (such as the Russell 1000 Growth). Note here that the value and growth indexes aren’t the same as the value factor. As defined earlier in this report, the value factor is the cheapest quintile of stocks minus the most expensive quintile of stocks. Value and growth indexes are less precise, with some companies close to the value-growth dividing line showing up in both indexes, albeit at lower weights. That said, the growth and value indexes are generally representative of the performance of the value factor, certainly directionally. Value indexes have only a 9.5% weighting to tech while growth’s weighting is a massive 43.7%. Conversely, traditional value sectors such as energy and financials have a much greater weighting in value indexes than growth indexes. In the Russell 1000 Value index the energy and financials sectors equal 22.7%. In the growth index, the combined weight of these two sectors is 2.1% — one-fifth of Apple’s weight alone (10.8%). These sectors have materially underperformed over the past decade-plus.
(When) Will it Turn?
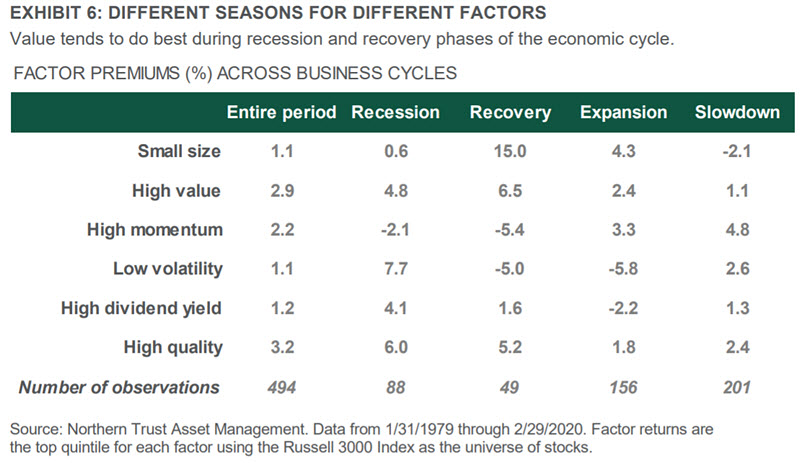
Given such massive growth stock outperformance of late, the difference between value and growth valuations are near all-time highs. The last time the differential was this big was during the dotcom bubble, and value outperformed for a number of years afterwards. But valuation disparities aren’t enough for value stocks to come back en vogue. There needs to be a catalyst — and this catalyst may come in the form of macro or micro developments. Macro-wise, Exhibit 6 shows the factor premiums of value along with the other factors we endorse (size, momentum, low volatility, dividend yield and quality) across the phases of the economic cycle. We observe that value tends to do best in the recovery phase of the economic cycle, which we are currently in. That said, this has been a very unique economic cycle and we also appreciate the fact that value showed underperformance from 2009 through 2011 — the heart of the global financial crisis recovery.
However, the global financial crisis recovery was not a traditional recovery in the sense that inflation and interest rates — two drivers of value outperformance — remained well below market expectations. Today, interest rates and inflation also remain very low, but so do market expectations (perhaps part of the reason for the large valuation discrepancy between value and growth). Our base case, per our Stuckflation Tested five-year theme, is that inflation will remain relatively muted but will be higher than what we have seen over the past decade. Our forecast is for U.S. inflation to average 2.0% over the next five years. However, this is actually above current consensus of 1.5% and there are real threats that could push inflation higher than our forecast. These threats include massive monetary and fiscal stimulus, a reversal in the globalization trend of the past few decades and increasing company focus on resiliency over efficiency. Overall, any potential for higher inflation (and, therefore, higher interest rates) than we — and the markets — expect could support the value factor.
While the macro environment may provide some support to the value factor, the more likely catalyst is at the micro level; specifically, a tempering of the torrid pace at which growth stocks — most importantly technology stocks — have been appreciating. There are a couple general facts of economic life that may catch up with these fast growers:
- Natural competition: While tech stocks today have fairly impressive “moats” around them, the massive profits they are earning will be attractive to others, encouraging competition.
- Regulation: As former U.S. president Ronald Reagan famously said about the government’s intervention philosophy: “If it moves, tax it; if it keeps moving, regulate it; if it stops moving, subsidize it.” Higher taxes and increased regulation may be coming for an industry that has been more than just moving, but, in fact, has been in an all-out sprint.
What Do You Do While You Wait?
The wait for value to start working again has been a long one. Even with the potential catalysts described above, we could be waiting for a while longer still. As such, while we don’t think investors should abandon value strategies, we do believe there are some approaches investors can take to mitigate, or possibly prevent, underperformance in the meantime. The following are some of the approaches we take within our value strategies to moderate periods of value underperformance; reduce active risk to broad benchmarks (i.e., Russell 1000); and remedy issues with book value:
- Combine the value factor with a quality factor: Some stocks are cheap because, frankly, they should be. Their earnings potential is low and their balance sheets are poorly managed. Combining the value factor with a quality factor (for which, Northern Trust Asset Management has its own proprietary measure) helps to avoid investing in “value traps” (stocks that are cheap but remain cheap and continue to underperform). Instead, focus will be on stocks that are inexpensive but maybe shouldn’t be. In addition, investing at the intersection of value and quality helps to smooth returns over time, leading to a lower risk profile. From 1979 through June 2020, a simple value portfolio returned 13.6% annually (vs. the Russell 1000 return of 11.7%) and had a risk level (standard deviation) of 17.4% (vs. the Russell 1000 risk level of 15.2%). Over that same time frame, a value/quality portfolio returned 14.2% annually with a risk level of 15.3%. Overall, the introduction of quality resulted in higher returns and lower risk.
- Go sector neutral: As noted earlier, value’s underperformance has been driven by the sectors that value stocks tend to be in — or not in, specifically technology. Instead of purely investing in value stocks regardless of sector, we take a sector-neutral approach. This removes unintended sector bets when harvesting the value premium. Related, for global strategies, we also take a region-neutral approach so that our strategies don’t load up on “value” regions (such as Japan, for instance). All of this helps to reduce active risk of our strategies, such that any underperformance versus the benchmark is limited.
- Use different valuation metrics: As also noted earlier, price-to-book has lost some relevance. Instead, investing in value companies based on cash flow valuations — and especially free cash flow (cash flow after capital expenditures) valuations — have resulted in superior returns over the past few decades, and increasingly lately. Exhibit 7 shows the growth of $1 using value strategies based on book value, cash flow and free cash flow. Book-value-based metrics have turned $1 into $27 over the span of 35 years. But cash flow metrics have done better ($1 turned into $42) — and free cash flow has done even better than cash flow ($1 turned into over $77). We use a variety of valuation metrics, including the cash flow measures just described, in order to arrive at a more comprehensive approach to identifying value stocks.

Conclusion: Waiting for the Resurrection
The value factor has been a key consideration for investors ever since the “style box” was introduced by Morningstar in 1992, the same year of Fama-French’s famous paper. In reality, it has been a core tenet of investing for decades prior. But it has fallen on hard times, to the point where many investors are losing confidence. Value stocks, while always cheaper than growth stocks by definition, are now showing an extreme valuation differential to their growth counterparts — near all-time highs. We do not think it is time to give up on the value factor. In fact, to answer the question posed in the title of this piece, we believe it is more likely “spring-loaded” than a “value trap”. This belief is based on how cheap value stocks have become; the increasing likelihood that technology stock valuations have finally caught up to their growth potential; possible regulation and competitive forces; and the simple law of reversion to the mean. That said, we don’t know when “the spring” will release. While we wait, identifying “quality” value stocks, ensuring proper portfolio construction and using the “right” valuation metrics can help offset value factor underperformance.
Special thanks to Tom O’Shea, Investment Strategist, and Colin Cheesman, Investment Analyst, for data research. Also, thanks to the Northern Trust Asset Management Quantitative Research team for their data and insights into the value factor – both historically and today.
IMPORTANT INFORMATION. The information contained herein is intended for use with current or prospective clients of Northern Trust Investments, Inc. The information is not intended for distribution or use by any person in any jurisdiction where such distribution would be contrary to local law or regulation. Northern Trust and its affiliates may have positions in and may effect transactions in the markets, contracts and related investments different than described in this information. This information is obtained from sources believed to be reliable, and its accuracy and completeness are not guaranteed. Information does not constitute a recommendation of any investment strategy, is not intended as investment advice and does not take into account all the circumstances of each investor.
This report is provided for informational purposes only and is not intended to be, and should not be construed as, an offer, solicitation or recommendation with respect to any transaction and should not be treated as legal advice, investment advice or tax advice. Recipients should not rely upon this information as a substitute for obtaining specific legal or tax advice from their own professional legal or tax advisors. References to specific securities and their issuers are for illustrative purposes only and are not intended and should not be interpreted as recommendations to purchase or sell such securities. Indices and trademarks are the property of their respective owners. Information is subject to change based on market or other conditions. Investing involves risk- no investment strategy or risk management technique can guarantee returns or eliminate risk in any market environment.
Forward-looking statements and assumptions are Northern Trust’s current estimates or expectations of future events or future results based upon proprietary research and should not be construed as an estimate or promise of results that a portfolio may achieve. Actual results could differ materially from the results indicated by this information.
Past performance is no guarantee of future results. Performance returns and the principal value of an investment will fluctuate. Performance returns contained herein are subject to revision by Northern Trust. Comparative indices shown are provided as an indication of the performance of a particular segment of the capital markets and/or alternative strategies in general. Index performance returns do not reflect any management fees, transaction costs or expenses. It is not possible to invest directly in any index. Gross performance returns contained herein include reinvestment of dividends and other earnings, transaction costs, and all fees and expenses other than investment management fees, unless indicated otherwise.
Northern Trust Asset Management is composed of Northern Trust Investments, Inc., Northern Trust Global Investments Limited, Northern Trust Fund Managers (Ireland) Limited, Northern Trust Global Investments Japan, K.K., NT Global Advisors, Inc., 50 South Capital Advisors, LLC, and personnel of The Northern Trust Company of Hong Kong Limited and The Northern Trust Company.
© 2020 Northern Trust Corporation. Head Office: 50 South La Salle Street, Chicago, Illinois 60603 U.S.A. northerntrust.com