
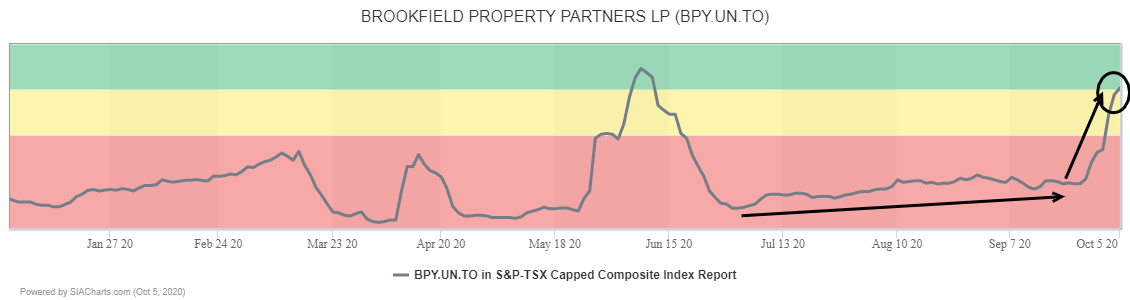
Diversified REIT Brookfield Property Partners (BPY.UN) returned to the Green Favored Zone of the SIA S&P/TSX Composite Index Report for the first time since June after moving up 8 spots yesterday and 113 spots in the last month. BPY.UN is also sitting in 10th place within the Green Favored Zone of the SIA S&P/TSX 60 Index Report.

Brookfield Property Partners (BPY.UN.TO) units have been under steady accumulation for the last six months as shown by the rising trend of higher lows and two bullish Ascending Triangle breakouts. Gains have accelerated in recent days since breaking out over $15.50, with the units advancing on a test of $18.50 initial resistance where a previous high and a measured move converge. Next potential resistance after that appears in the $20.00 to $20.50 zone between a round number and a point where multiple measured moves converge. Initial support appears near the $15.50 breakout point.
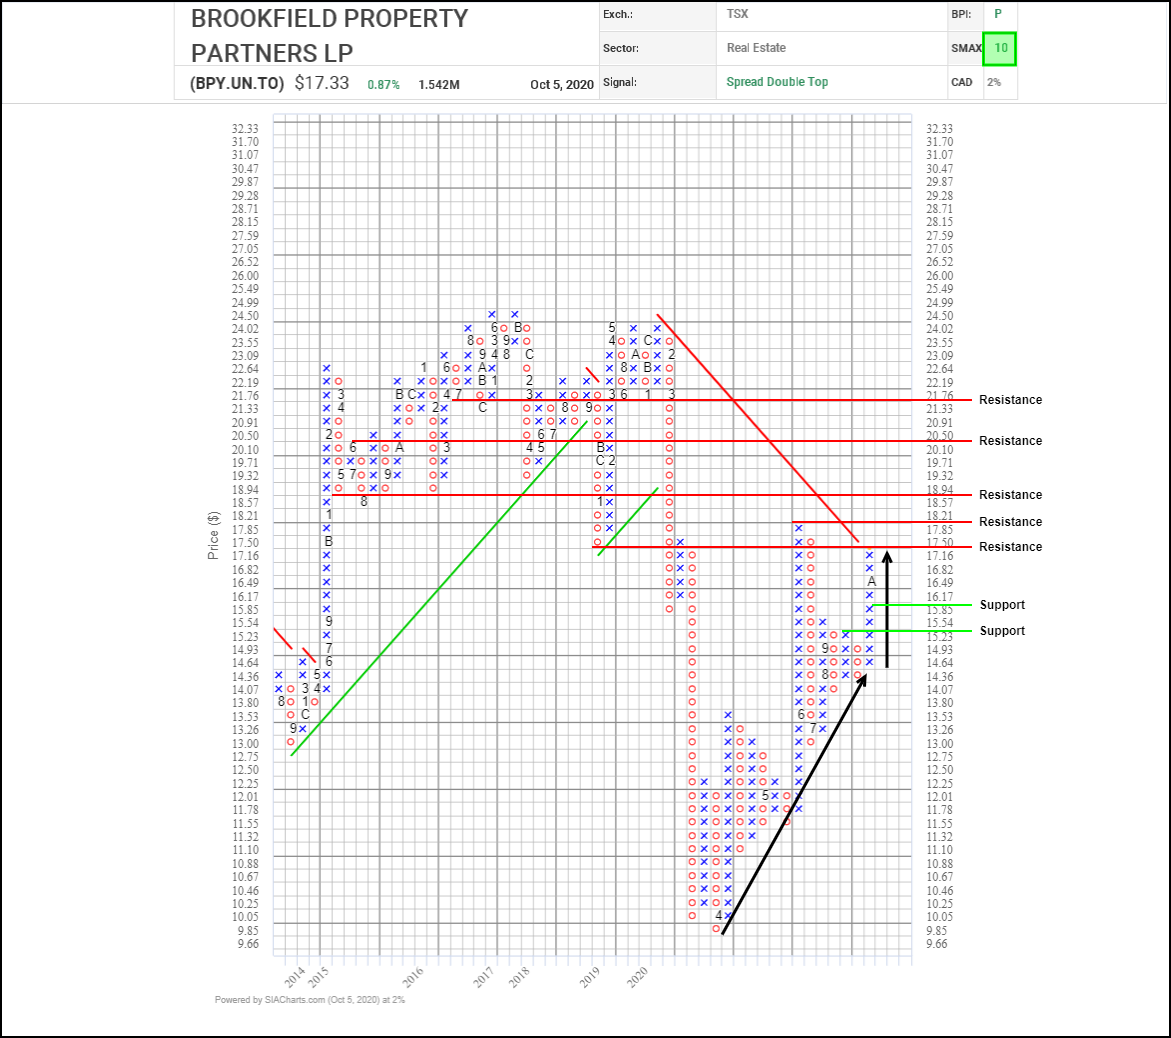
Since bottoming out in April, units of Brookfield Property Partners (BPY.UN.TO) have been steadily recovering lost ground. Recently, accumulation has accelerated with the shares completing a bullish Spread Double Top pattern and continuing to advance.
The units are approaching initial resistance in the $17.50 to $18.20 zone where a downtrend line plus previous column highs and lows cluster. A breakthrough there would confirm the start of a new uptrend with next potential resistance tests after that near $18.95 ad $20.50 based on horizontal counts. Initial support appears near $15.85 based on a 3-box reversal.
With a perfect SMAX score of 10, BPY.UN.TO is exhibiting near-term strength across the asset classes.
Disclaimer: SIACharts Inc. specifically represents that it does not give investment advice or advocate the purchase or sale of any security or investment whatsoever. This information has been prepared without regard to any particular investors investment objectives, financial situation, and needs. None of the information contained in this document constitutes an offer to sell or the solicitation of an offer to buy any security or other investment or an offer to provide investment services of any kind. As such, advisors and their clients should not act on any recommendation (express or implied) or information in this report without obtaining specific advice in relation to their accounts and should not rely on information herein as the primary basis for their investment decisions. Information contained herein is based on data obtained from recognized statistical services, issuer reports or communications, or other sources, believed to be reliable. SIACharts Inc. nor its third party content providers make any representations or warranties or take any responsibility as to the accuracy or completeness of any recommendation or information contained herein and shall not be liable for any errors, inaccuracies or delays in content, or for any actions taken in reliance thereon. Any statements nonfactual in nature constitute only current opinions, which are subject to change without notice.