by Don Vialoux, EquityClock.com
Editor’s Note: Next Tech Talk report will be released on (Canadian Thanksgiving) Monday October 12th
The Bottom Line
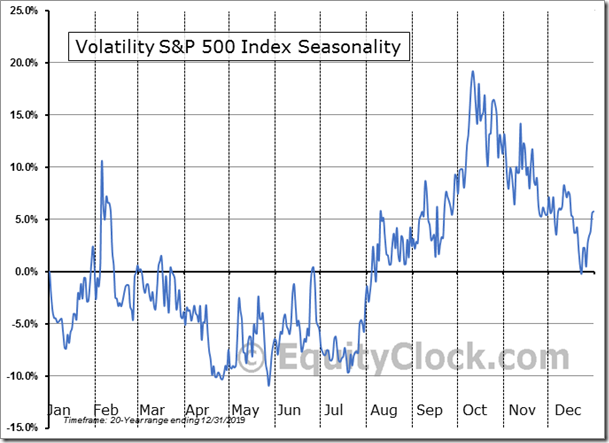
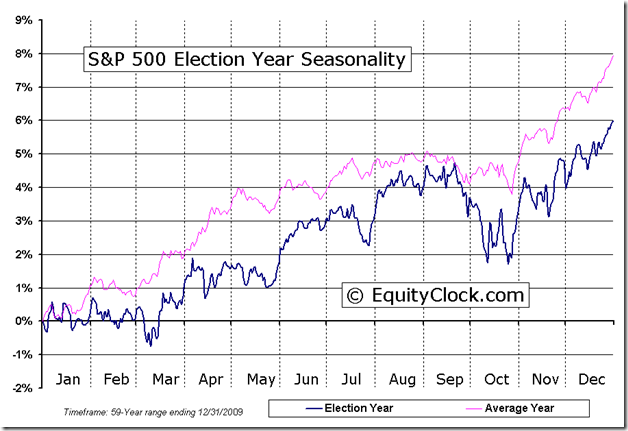
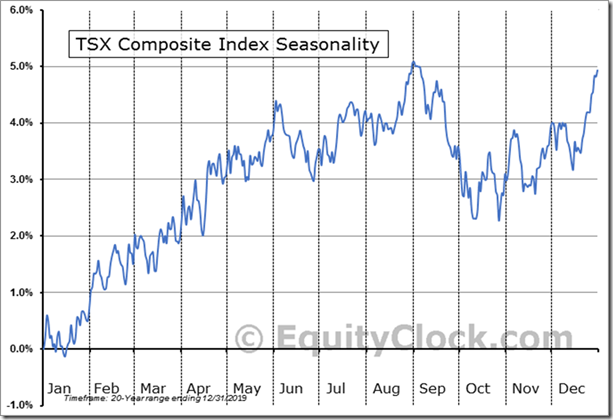
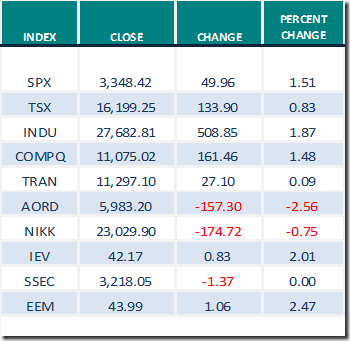
Most major equity indices around the world mostly moved higher last week. Greatest influences remain growing evidence of a second wave of the coronavirus (negative) and possible approval of a vaccine (positive). Momentum indicators for North American equity markets increased last week from intermediate oversold to intermediate neutral levels. The VIX Index remained elevated. News that President Trump has contacted COVID 19 added to volatility on Friday. Weakest four week period in the year for most equity market indices around the world is between mid-September and mid-October (particularly the TSX Composite Index and U.S. equity indices during U.S. Presidential election years). Look for volatile, choppy equity markets between now and at least mid-October.
Observations
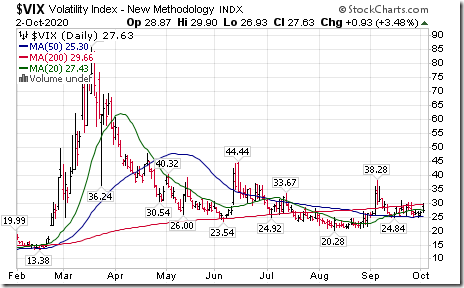
The VIX Index (better known as the Fear Index) showing volatility by the S&P 500 Index remained elevated last week. It increased from 26.38% to 27.63%
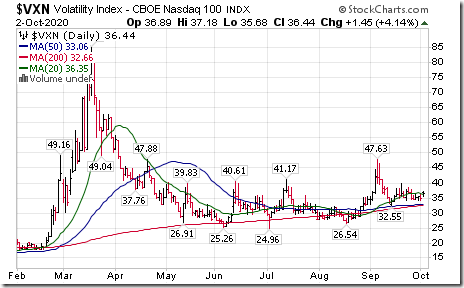
Ditto for VXN showing volatility by the NASDAQ 100 Index, up 1.51 to 36.44%.
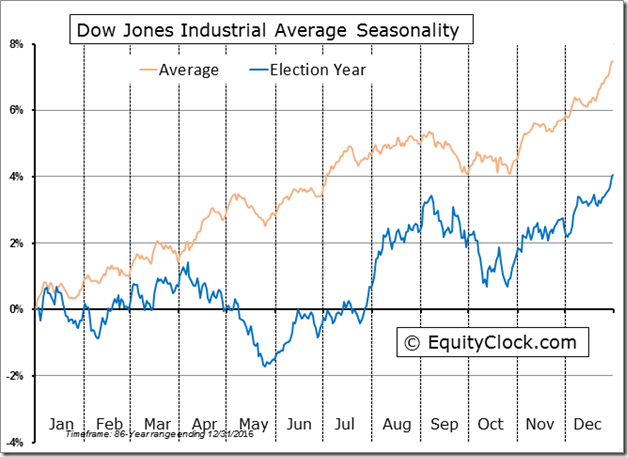
The Dow Jones Industrial Average and S&P 500 Index during U.S. Presidential Election years are following their historic trend. They move lower from early September to the third week of October followed by a move higher after the election.
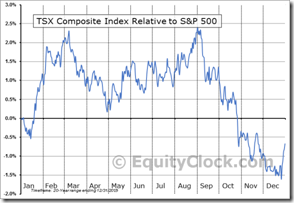
The TSX Composite Index also is following its seasonal pattern this year. History shows the Index moving lower on a real basis from the beginning of September to the third week of October. On a relative basis, the Index moves lower from the beginning of September to mid-December.
S&P/TSX Composite Index Seasonal Chart
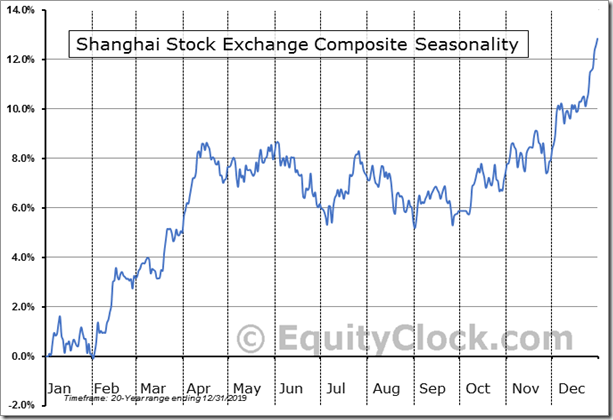
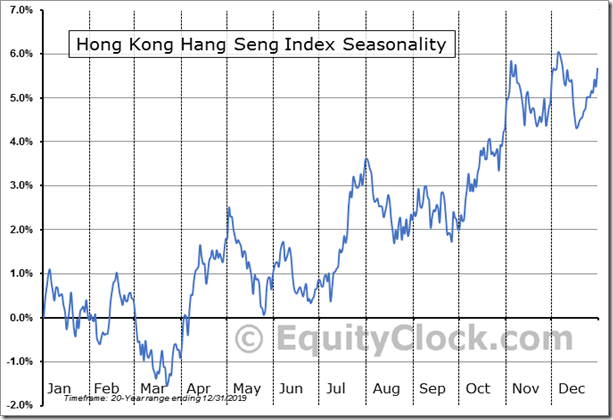
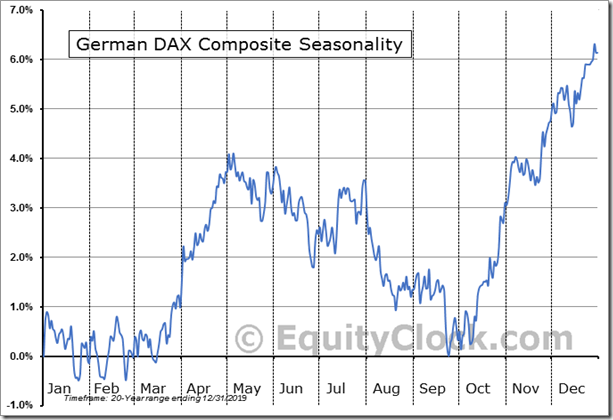
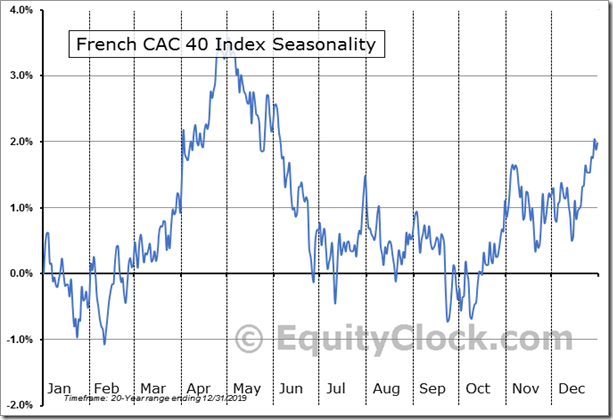
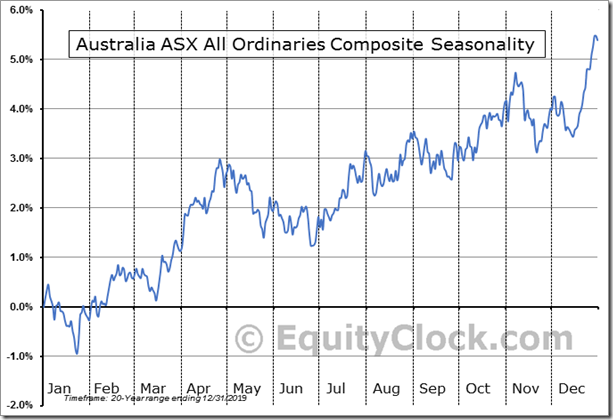
Seasonal influences turned positive on a real and relative basis near the end of September for the Shanghai Composite Index, the Hang Seng Index, DAX Index, Australia Ordinaries Index, CAC Index, London FT Index (and related ETFs). Last week, Far East equity markets mostly were mixed/slightly lower while European and emerging equity markets mostly were stronger with gains greater than U.S. equity markets.
.
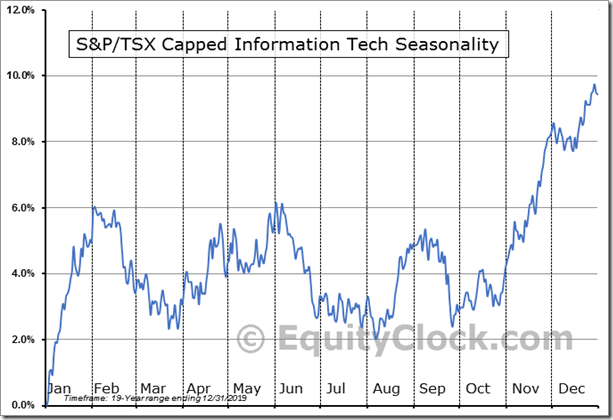
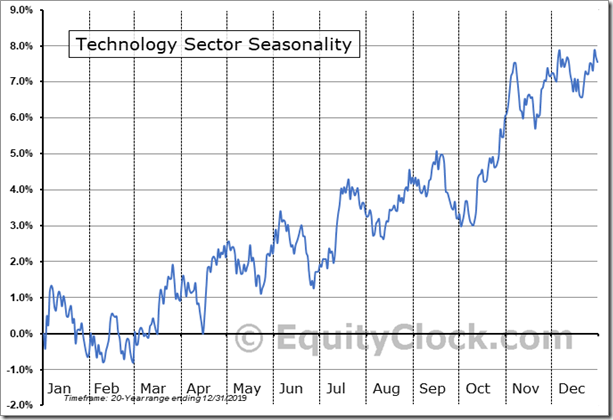
Seasonality for the Canadian and U.S. technology sectors and related ETFs turned positive on schedule on a real and relative basis near the end of September. Technology stocks and related ETFs (e.g. XIT.TO and XLK) recorded significant gains last week.
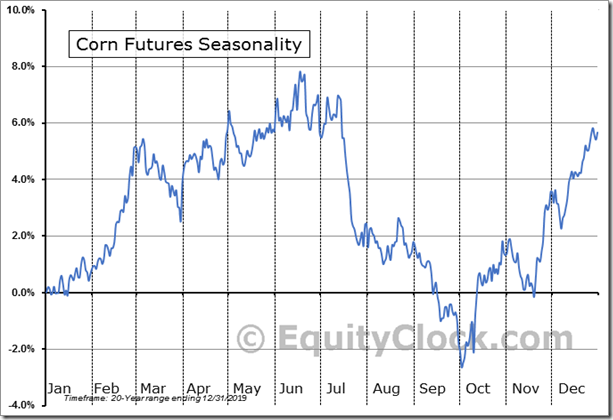
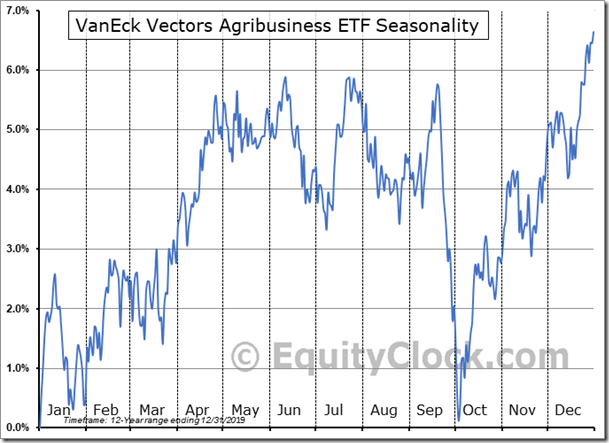
Seasonality for grain prices (Wheat, Corn and Soybeans), Agribusiness equities and related ETFs turned positive on schedule near the end of September. Grain prices and related exchange traded notes recorded significant gains last week.
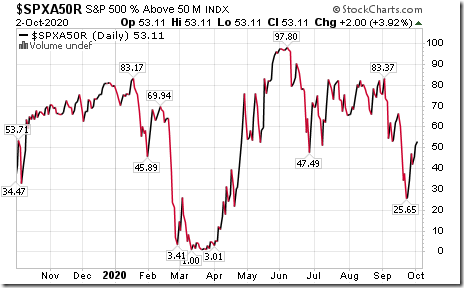
Medium term technical indicator for U.S. equity markets (e.g. Percent of S&P 500 stocks trading above their 50 day moving average) moved higher last week. It changed from intermediate oversold to intermediate neutral. See Barometer chart at the end of this report.
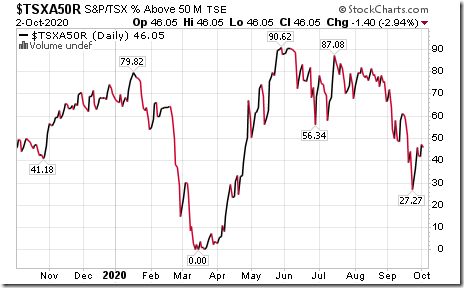
Medium term technical indicator for Canadian equity markets also moved higher last week It changed from intermediate oversold to intermediate neutral. See Barometer chart at the end of this report.
More short term short term momentum indicators for U.S. markets/commodities/sectors (20 day moving averages, short term momentum indicators) increased last week.
Short term momentum indicators for Canadian markets/sectors were mostly unchanged last week.
Year-over-year 2020 consensus earnings and revenue declines by S&P 500 companies ebbed slightly again last west. According to www.FactSet.com, third quarter earnings are expected to fall 21.0% (versus previous decline of 21.2%) and revenues are expected to slip 3.6% (versus a previous decline of 3.8% last week). Fourth quarter earnings are expected to drop 12.7% and revenues are expected to decline 1.1% (versus a previous decline of 1.2%). Earnings for all of 2020 are expected to fall 18.0% and revenues are expected to decline 2.7%.
Consensus estimates for earnings and revenues by S&P 500 companies turn positive on a year-over-year basis in the first quarter of 2021, but at a slightly lower rate than the previous week. According to FactSet, earnings in the first quarter of 2021 are expected to increase 12.6% (versus previous 12.8% increase) and revenues are expected to increase 3.1%.. Earnings in the second quarter are expected to increase 43.8% (versus previous 44.1%) and revenues are expected to increase 13.7%. Earnings for all of 2021 are expected to increase 25.7% (versus previous 26.0%) and revenues are expected to increase 8.0% (versus previous 8.1%)
Economic News This Week
September Non-manufacturing ISM to be released at 10:00 AM EDT on Monday is expected to dip to 56.3 from 56.9 in August
August U.S. Trade Deficit to be released at 8:30 AM EDT on Tuesday is expected to increase to $66.30 billion from $63.60 billion in July.
August Canadian Trade Deficit to be released at 8:30 AM EDT on Tuesday is expected to increase to $2.50 billion from $2.45 billion in July.
FOMC Meeting Minutes are released at 2:00 PM EDT on Wednesday. No change in the Fed Fund rate is expected.
September Canadian Housing Starts to be released at 8:15 AM EDT on Thursday are expected to drop to 220,000 from 262,400 in August.
September Canadian Non-farm Payrolls to be released at 8:30 AM EDT on Friday are expected to increase to 275,000 from 245,000 in August. September Canadian Unemployment Rate is expected to slip to 10.1% from10.2% in August.
Selected Earnings News This Week
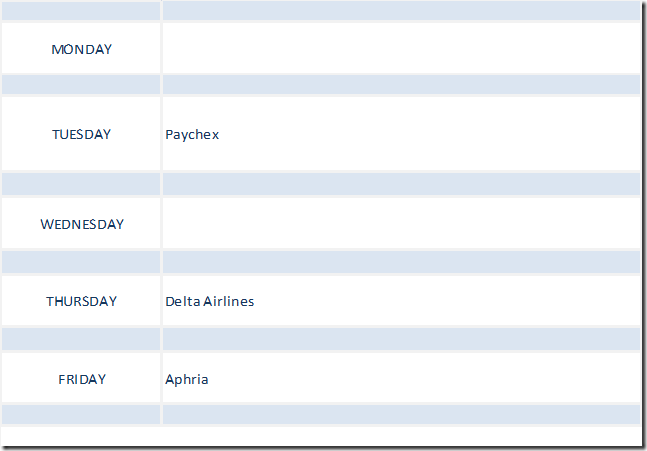
Four S&P 500 companies are scheduled to release quarterly results this week.
Trader’s Corner
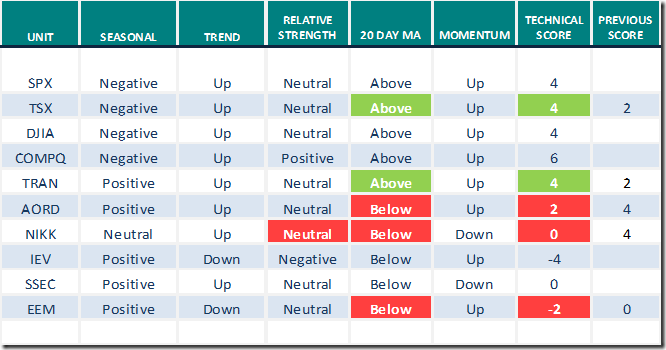
Daily Seasonal/Technical Equity Trends for October 2nd 2020
Green: Increase from previous day
Red: Decrease from previous day
Commodities
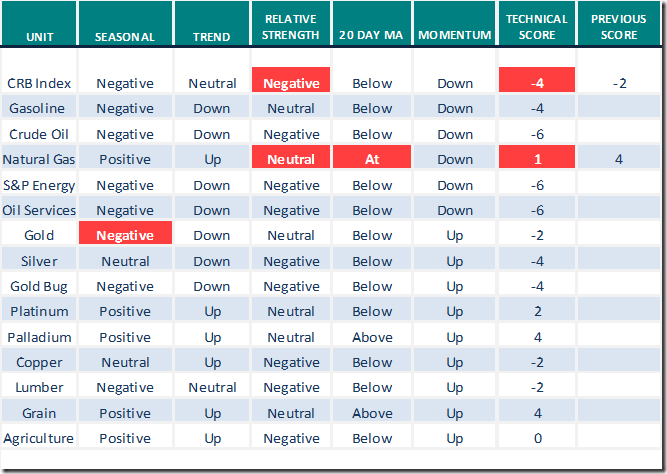
Seasonal/Technical Commodities Trends for October 2nd 2020
Green: Increase from previous day
Red: Decrease from previous day
Sectors
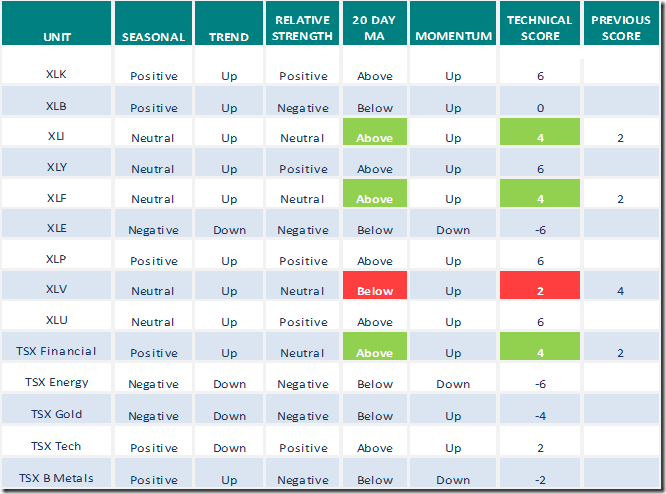
Daily Seasonal/Technical Sector Trends for October 2nd 2020
Green: Increase from previous day
Red: Decrease from previous day
Technical Scores
Calculated as follows:
Intermediate Uptrend based on at least 20 trading days: Score 2
(Higher highs and higher lows)
Intermediate Neutral trend: Score 0
(Not up or down)
Intermediate Downtrend: Score -2
(Lower highs and lower lows)
Outperformance relative to the S&P 500 Index: Score: 2
Neutral Performance relative to the S&P 500 Index: 0
Underperformance relative to the S&P 500 Index: Score –2
Above 20 day moving average: Score 1
At 20 day moving average: Score: 0
Below 20 day moving average: –1
Up trending momentum indicators (Daily Stochastics, RSI and MACD): 1
Mixed momentum indicators: 0
Down trending momentum indicators: –1
Technical scores range from -6 to +6. Technical buy signals based on the above guidelines start when a security advances to at least 0.0, but preferably 2.0 or higher. Technical sell/short signals start when a security descends to 0, but preferably -2.0 or lower.
Long positions require maintaining a technical score of -2.0 or higher. Conversely, a short position requires maintaining a technical score of +2.0 or lower
Changes Last Week
Technical Notes for Friday October 2nd
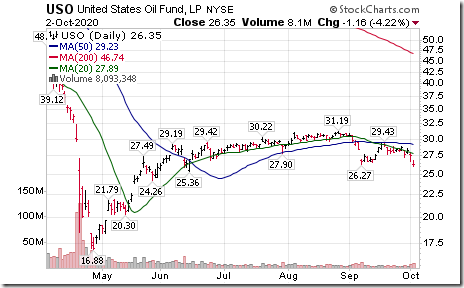
Crude Oil ETN (USO) moved below $26.27 extending an intermediate downtrend.
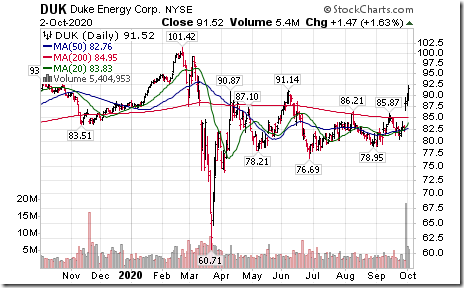
Duke Energy (DUK), an S&P 100 stock moved above $91.14 resuming an intermediate uptrend.
S&P 500 Momentum Barometer
The Barometer increased 2.00 on Friday and 18.84 last week to 53.11. It changed from intermediate oversold to intermediate neutral on a recovery above 40.00
TSX Momentum Barometer
The Barometer slipped 1.40 on Friday, but gained 9.31 last week to 46.05. It changed from intermediate oversold to intermediate neutral on a recovery above 40.00.
Disclaimer: Seasonality and technical ratings offered in this report and at
www.equityclock.com are for information only. They should not be considered as advice to purchase or to sell mentioned securities. Data offered in this report is believed to be accurate, but is not guaranteed
This post was originally publised at Vialoux's Tech Talk.


