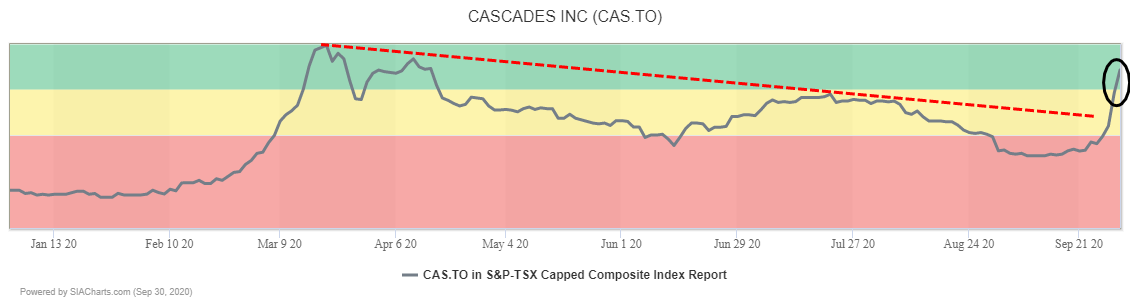
Paper producer Cascades (CAS.TO) moved up 28 spots yesterday and has jumped 96 places in the last month, driving up out of the red zone, through the yellow zone and returning to the Green Favored Zone of the SIA S&P/TSX Composite Index report for the first time since April.
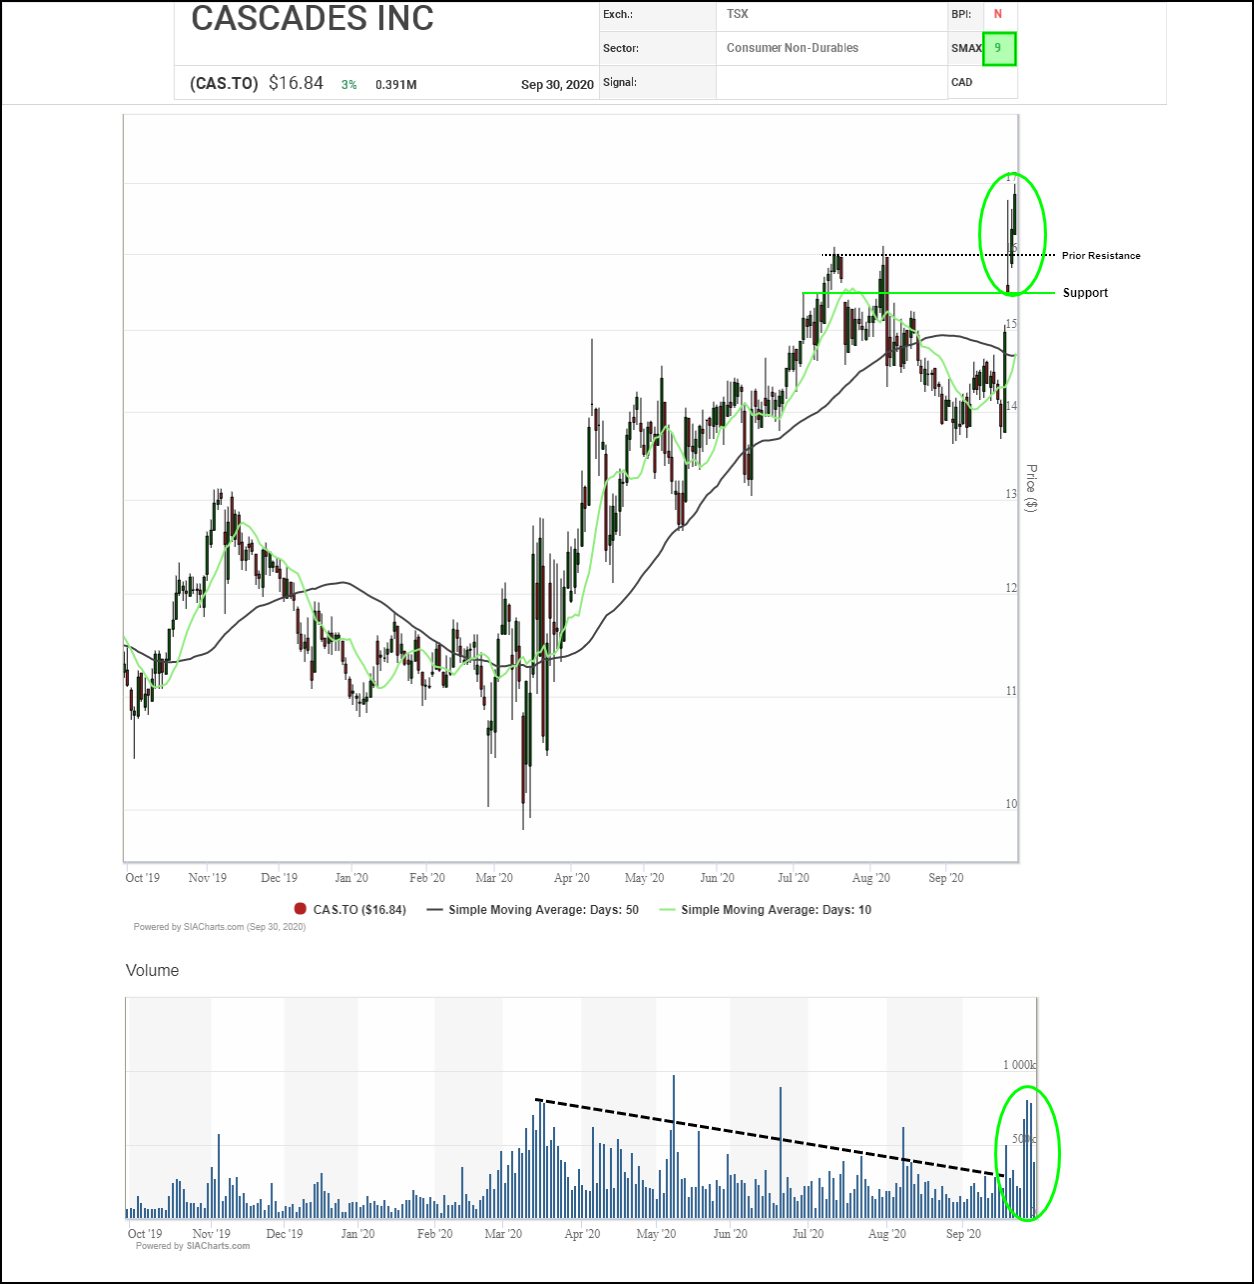
Cascades (CAS.TO) has attracted significant new interest in recent days, staging a breakaway gap, then breaking out to a new high and continuing upward on increased volume. Based on measured moves from the recent $13.75 to $16.00 trading range, next potential upside resistance on trend may appear near $18.25 then $20.50, along with the $20.00 round number. Initial support appears near $15.50, then $15.00, the boundaries of the recent breakaway gap.
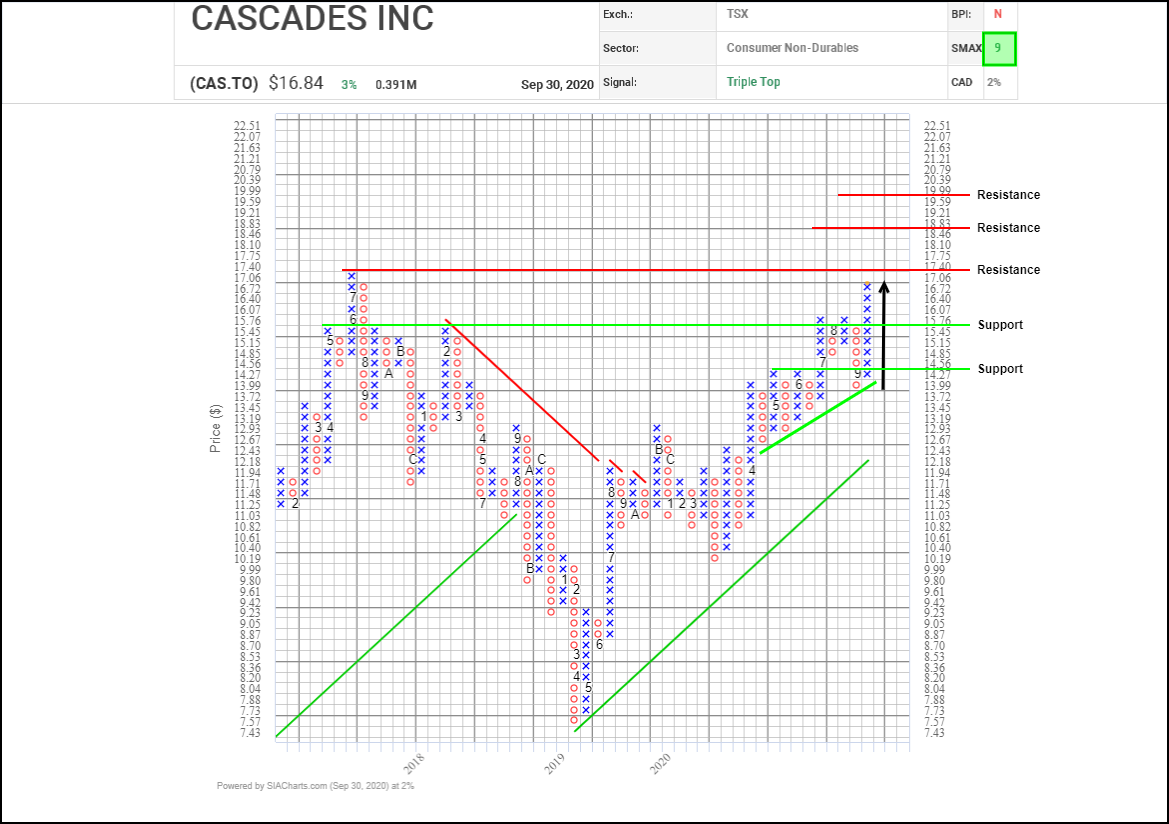
Since the spring, Cascades (CAS.TO) has been under steady accumulation with higher O column lows indicating a rising trend. Along the way, the shares have completed a number of bullish patterns including a Double Top, a Spread Double Top, and more recently, two consecutive bullish Triple Tops.
Potential upside resistance tests on trend include: the previous peak near $17.40, the $18.45 to $18.85 area where a number of vertical and horizontal counts cluster, and then the $20.00 round number. Initial support appears in the $15.45 to $15.75 area where a 3-box reversal and a recent breakout point converge.
With a bullish SMAX score of 9, CAS.TO is exhibiting near-term strength against the asset classes.
Disclaimer: SIACharts Inc. specifically represents that it does not give investment advice or advocate the purchase or sale of any security or investment whatsoever. This information has been prepared without regard to any particular investors investment objectives, financial situation, and needs. None of the information contained in this document constitutes an offer to sell or the solicitation of an offer to buy any security or other investment or an offer to provide investment services of any kind. As such, advisors and their clients should not act on any recommendation (express or implied) or information in this report without obtaining specific advice in relation to their accounts and should not rely on information herein as the primary basis for their investment decisions. Information contained herein is based on data obtained from recognized statistical services, issuer reports or communications, or other sources, believed to be reliable. SIACharts Inc. nor its third party content providers make any representations or warranties or take any responsibility as to the accuracy or completeness of any recommendation or information contained herein and shall not be liable for any errors, inaccuracies or delays in content, or for any actions taken in reliance thereon. Any statements nonfactual in nature constitute only current opinions, which are subject to change without notice.