by Don Vialoux, EquityClock.com
Technical Notes for September 10th
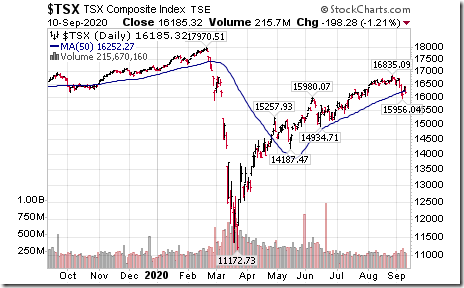
TSX Composite Index moved below its “institutionally sensitive” 50 day moving average.
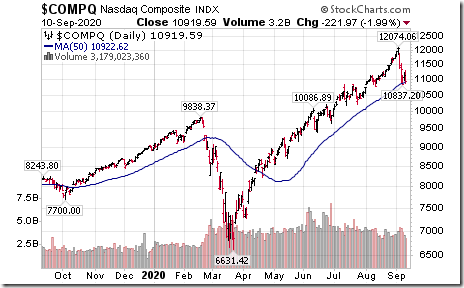
NASDAQ Composite Index moved below its “institutionally sensitive” 50 day moving average.
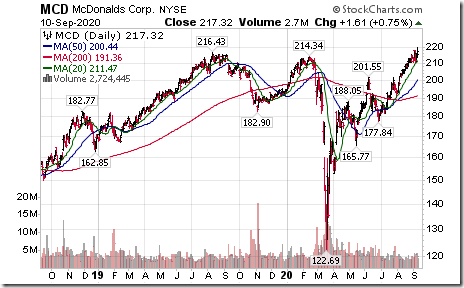
McDonalds (MCD), a Dow Jones Industrial Average stock moved above $216.43 to an all-time high extending an intermediate uptrend.
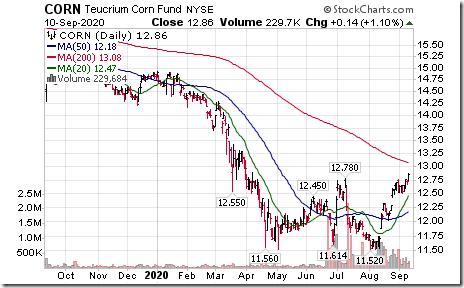
Corn ETN (CORN) moved above $12.78 completing a double bottom pattern.
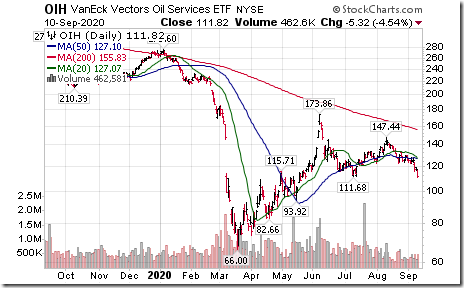
Oil Services ETF (OIH) moved below $111.68 setting an intermediate downtrend.
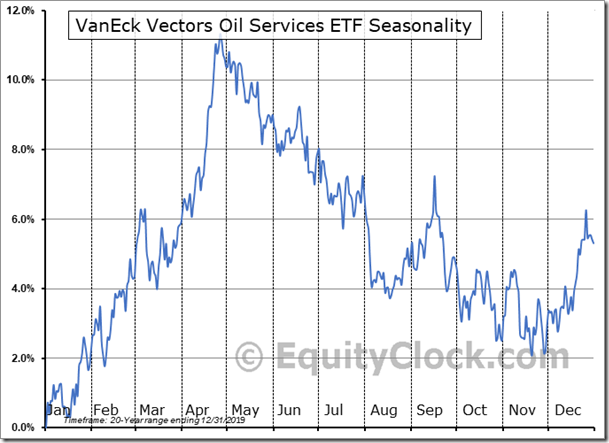
‘Tis the season for weakness in the oil services sector to the end of November!
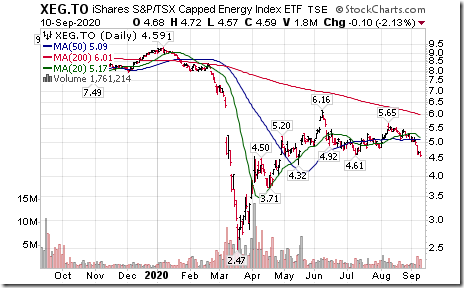
The ETF tracking the TSX Energy Index moved below $4.61 setting an intermediate downtrend
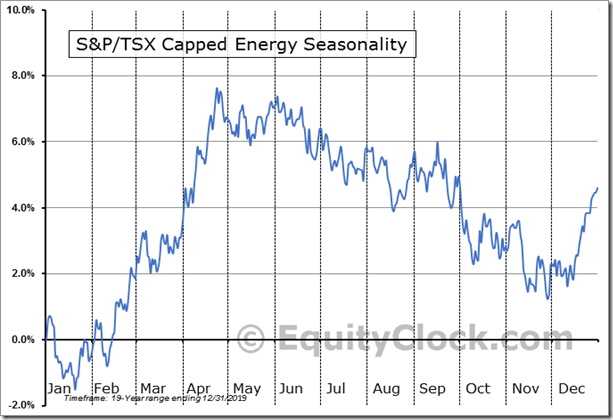
‘Tis the season for the Canadian Energy sector to move lower to the end of November!
Comments from Canada’s top energy analyst, Josef Schachter:
Conclusion: Observations on the Energy sector
As we write this, WTI for October is at US$37.53/b down $0.52 on the day and down sharply from US$41.65/b last Wednesday. This decline of over US$4/b or down by nearly 10% in just one week is due to OPEC excess production and the rise in storage worldwide. The US build data today is the clear evidence of this. Crude prices should continue to decline in September as US consumption normally declines by 1.0-1.5Mb/d as the summer driving season ends. Further pressure is likely to come from OPEC as they raised production by 2.0Mb/d in August. They meet virtually next week, September 17th, and if they don’t reverse their increase in August (or cut it somewhat) then prices are likely to erode further. The psychological level of US$40/b was breached last week and the support at US$38.72/b has also now occurred confirming a top for crude. The next key level for WTI is US$34.36/b. If this is breached then the sector will face increased pressure. We see most energy stocks have significant downside risk. The most vulnerable companies are energy and energy service companies with high debt loads, high operating costs, declining production, current balance sheet debt maturities of some materiality within the next 12 months and those that produce heavier crude barrels. Results for Q3 and likely Q4/20 for most energy and energy service companies should be short of the prior year’s level which when reported will add to the downside pressure.
Hold cash and remain patient for the next low risk BUY window expected during Q4/20.
The S&P/TSX Energy Index fell nearly 9% to the 72 level today versus 79 last week. From the June high at 96 when we recommended profit taking the index is down by 25%. We see much more downside over the coming months. The support at 74.67 has been breached and the next downside target for the index
The S&P/TSX Energy Index fell nearly 9% to the 72 level today versus 79 last week. From the June high at 96 when we recommended profit taking the index is down by 25%. We see much more downside over the coming months. The support at 74.67 has been breached and the next downside target for the index is the 50 level. Further lows are likely in Q4/20 as tax loss selling could be very nasty this year.
Subscribe to the Schachter Energy Report and receive access to all archived Webinars, Action Alerts, TOP PICK recommendations when the next BUY signal occurs, as well as our Quality Scoring System review of the 27 companies that we cover. We go over the markets in much more detail and highlight individual companies in our two monthly reports. If you are interested in the energy industry this should be of interest to you.
Editor’s Note: Josef offers a paid subscription service. Subscribe by contacting www.schachterenergyreport.ca
Trader’s Corner
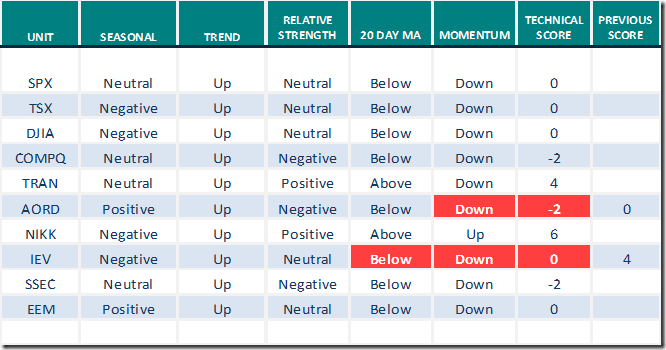
Equity Indices and related ETFs
Daily Seasonal/Technical Equity Trends for September 10th 2020
Green: Increase from previous day
Red: Decrease from previous day
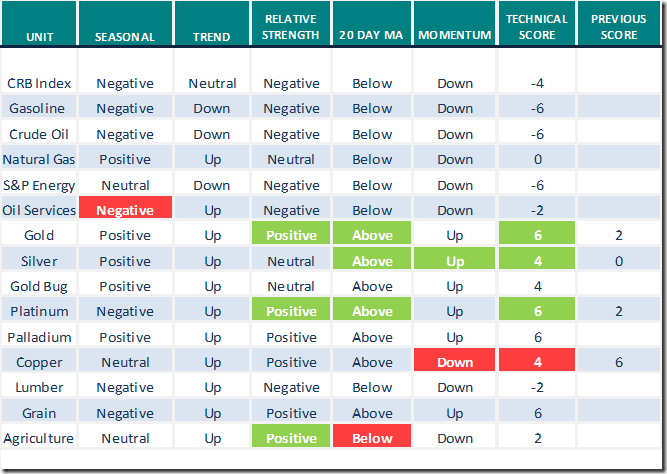
Commodities
Seasonal/Technical Commodities Trends for September 10th 2020
Green: Increase from previous day
Red: Decrease from previous day
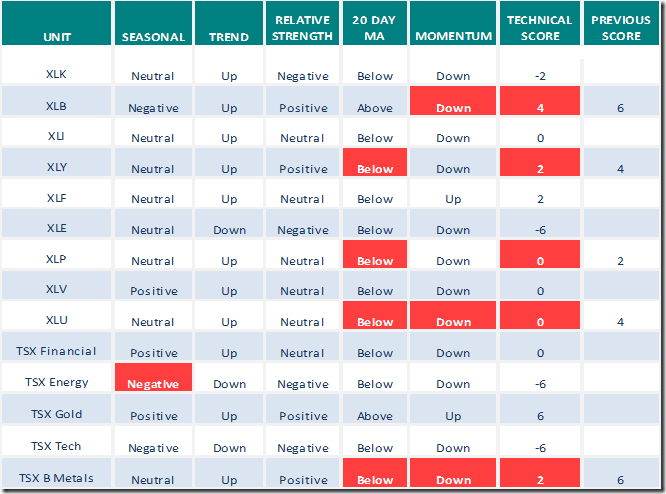
Sectors
Daily Seasonal/Technical Sector Trends for September 10th 2020
Green: Increase from previous day
Red: Decrease from previous day
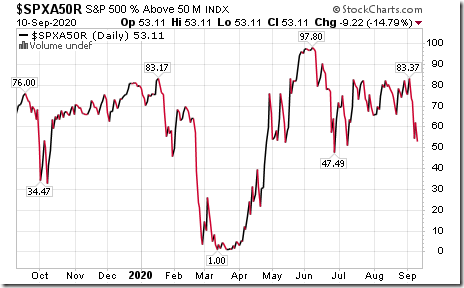
S&P 500 Momentum Barometer
The Barometer dropped 9.22 to 53.11 yesterday. It changed from intermediate overbought to intermediate neutral on a drop below 60.00. Intermediate trend remains down.
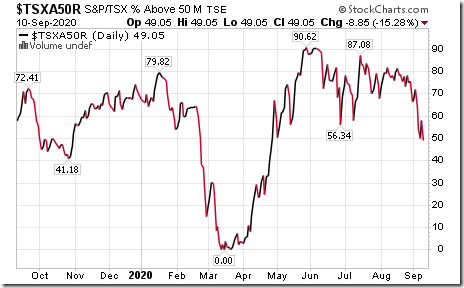
TSX Momentum Barometer
The Barometer dropped 8.85 to 49.05 yesterday. It remains intermediate neutral. Intermediate trend remains down.
Disclaimer: Seasonality and technical ratings offered in this report and at
www.equityclock.com are for information only. They should not be considered as advice to purchase or to sell mentioned securities. Data offered in this report is believed to be accurate, but is not guaranteed
This post was originally publised at Vialoux's Tech Talk.


