
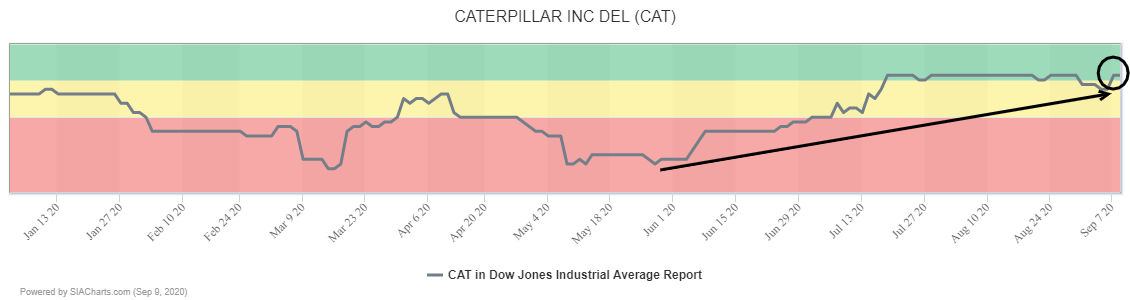
Caterpillar (CAT) recently returned to the Green Favored Zone of the SIA Dow Jones Industrial Average Report from a brief dip into the yellow zone and is currently sitting in 7th place.
The technical picture for Caterpillar (CAT) continues to improve with a number of recent bullish signals appearing lately, including, the snapping of a long-term downtrend line, breakouts over $145 and $150 to their highest level since early 2018, and a Golden Cross of the 50 and 200 day averages. These indicators have combined to confirm the upward trend which started back in March.
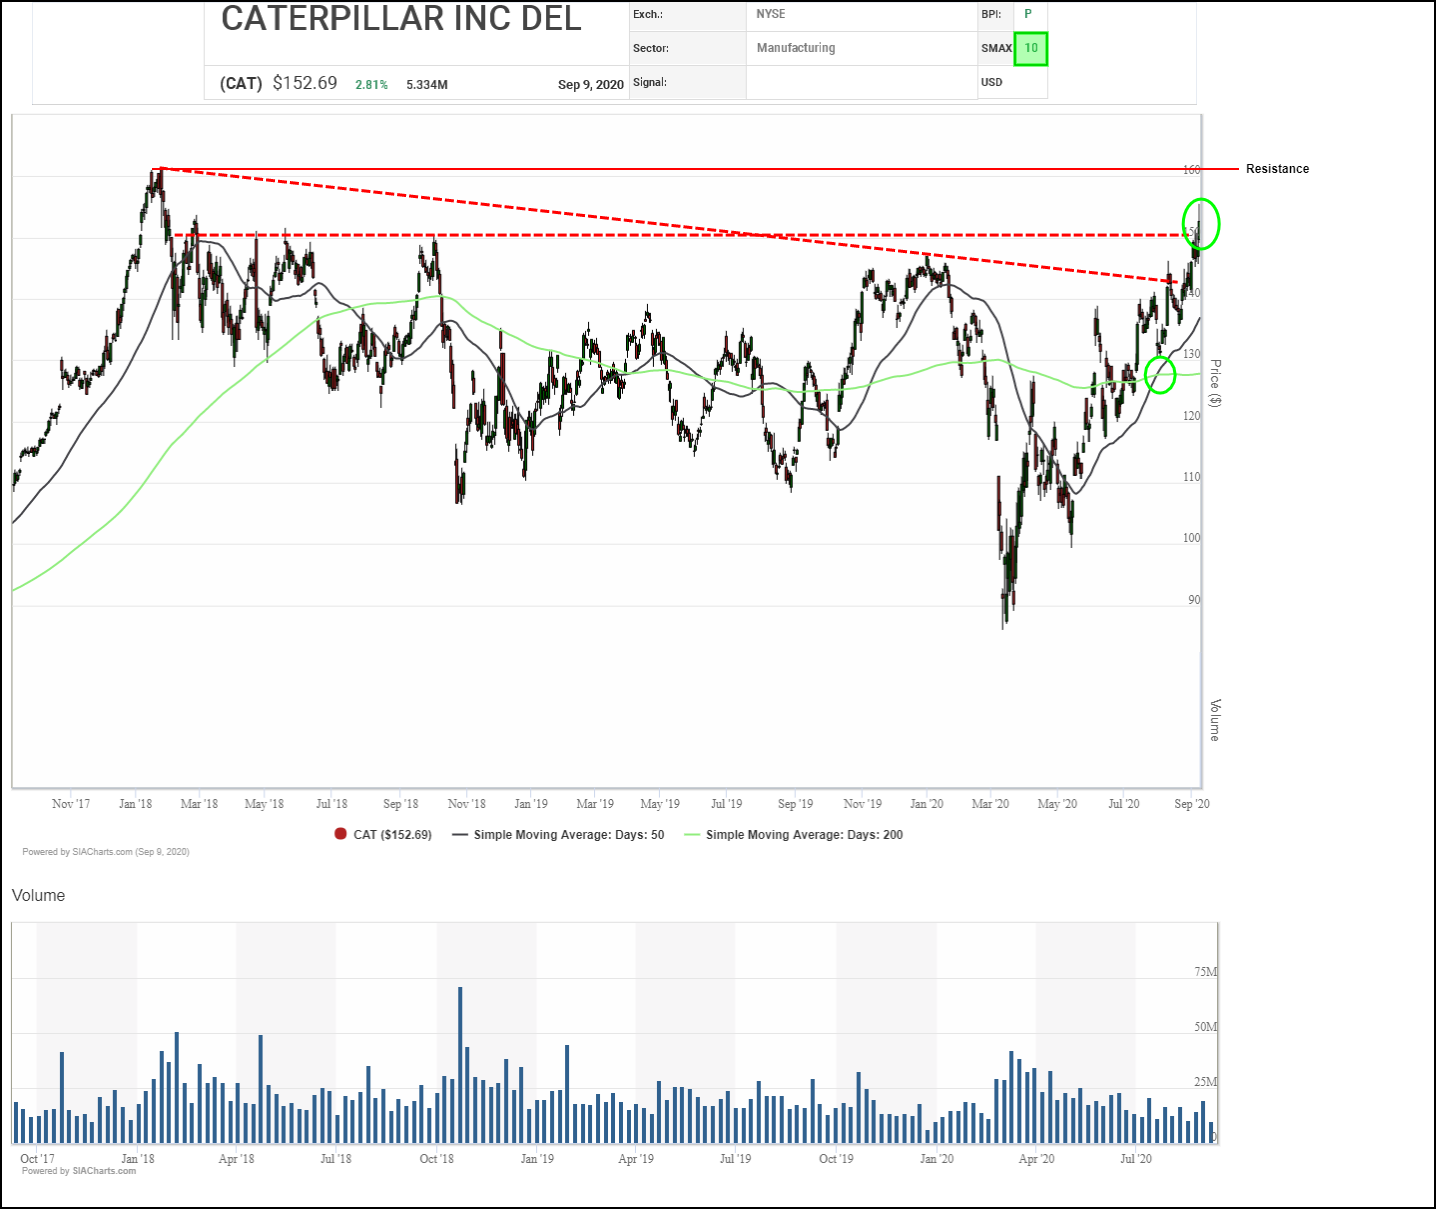
Next potential upside resistance appears at the previous high near $162, followed by $175 where a round number and measured move converge. Initial support appears near the $150 round number, then a previous breakout point near $142.
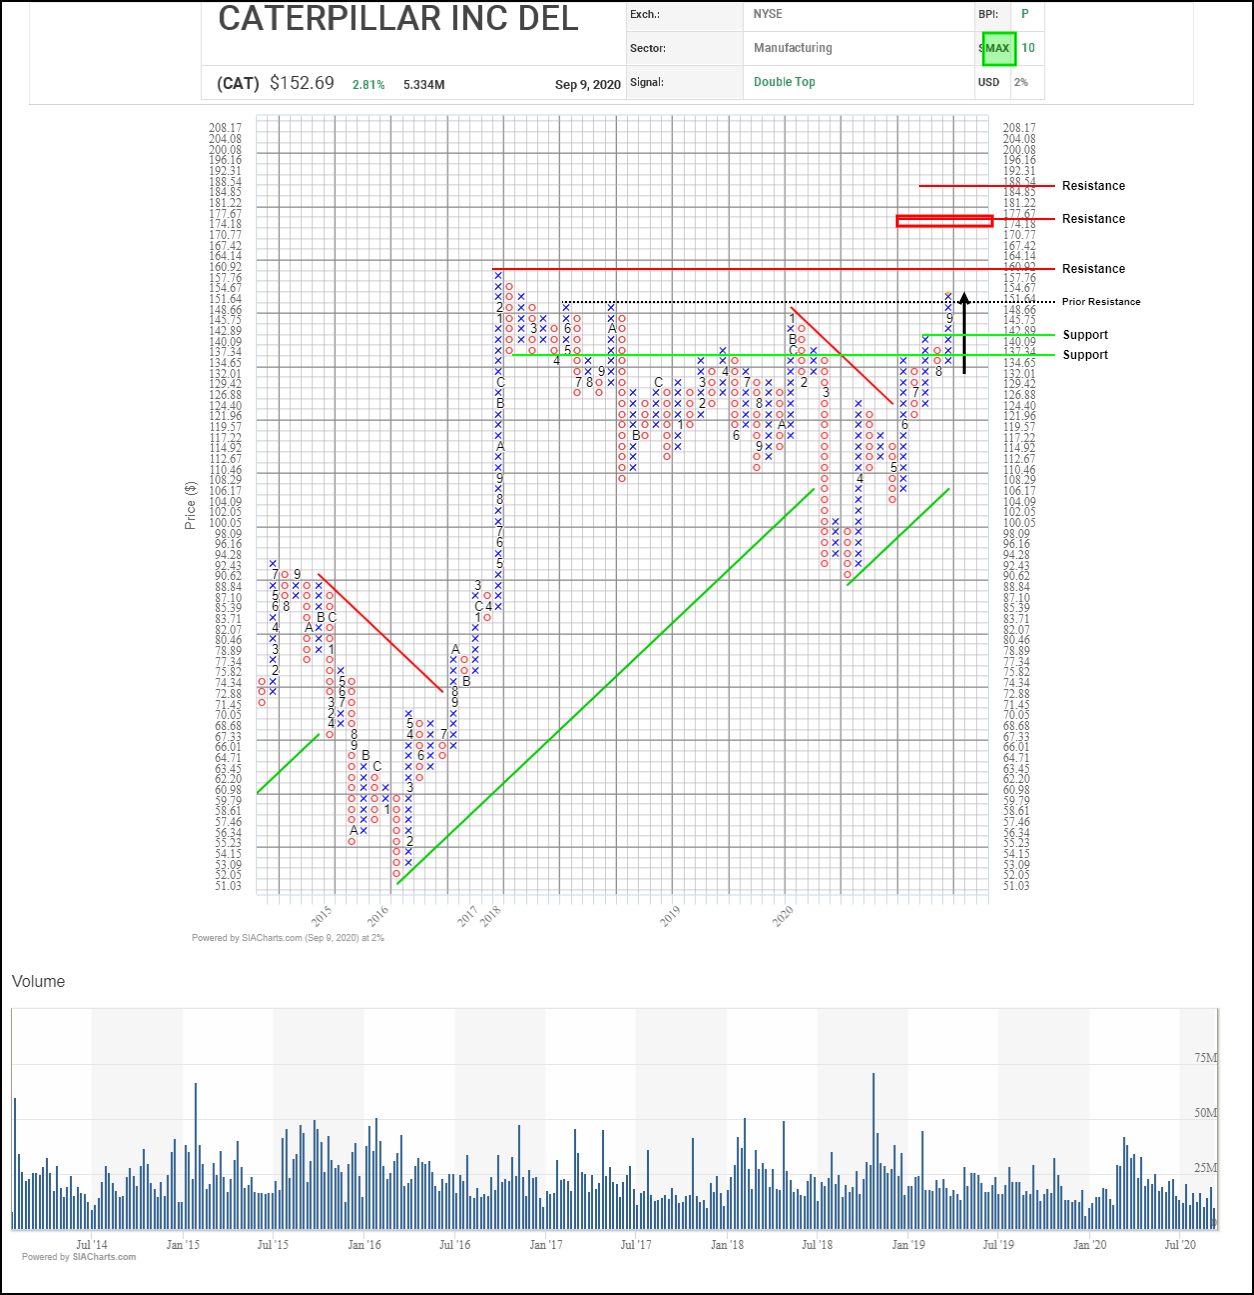
Building on a recent bullish Double Top breakout, Caterpillar has rallied up above $150.00 to complete a larger bullish Spread Double Top and confirms continuing accumulation. Next potential upside resistance may appear at the previous high near $164.00, then the $174.00-$177.00 range and near $188.50 based on vertical and horizontal counts. Initial support appears near $140.10 based on a 3-box reversal and a previous breakout point. With a perfect SMAX score of 10, CAT is exhibiting near-term strength across the asset classes.
Disclaimer: SIACharts Inc. specifically represents that it does not give investment advice or advocate the purchase or sale of any security or investment whatsoever. This information has been prepared without regard to any particular investors investment objectives, financial situation, and needs. None of the information contained in this document constitutes an offer to sell or the solicitation of an offer to buy any security or other investment or an offer to provide investment services of any kind. As such, advisors and their clients should not act on any recommendation (express or implied) or information in this report without obtaining specific advice in relation to their accounts and should not rely on information herein as the primary basis for their investment decisions. Information contained herein is based on data obtained from recognized statistical services, issuer reports or communications, or other sources, believed to be reliable. SIACharts Inc. nor its third party content providers make any representations or warranties or take any responsibility as to the accuracy or completeness of any recommendation or information contained herein and shall not be liable for any errors, inaccuracies or delays in content, or for any actions taken in reliance thereon. Any statements nonfactual in nature constitute only current opinions, which are subject to change without notice.