
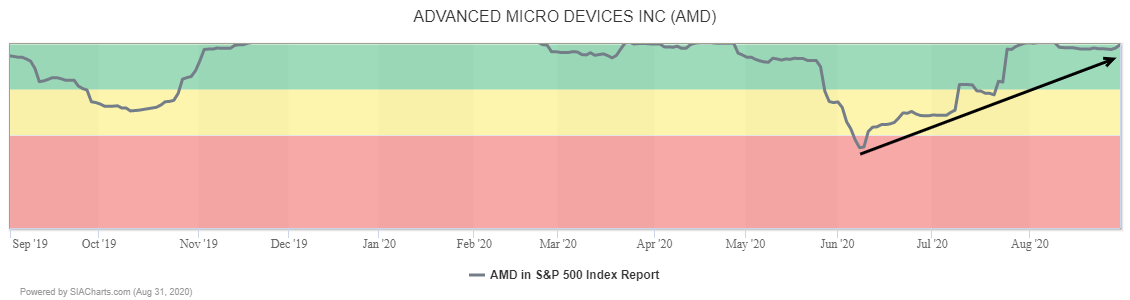
Chipmaker Advanced Micro Devices (AMD) remains near the top of the Green Favored Zone in the SIA S&P 500 Index Report after moving up 9 spots yesterday to 6th place.

A major breakout is underway in Advanced Micro Devices (AMD) which rallied to a new all-time yesterday, completing its second bullish Ascending Triangle pattern of the year and signaling the start of a new upleg. Next potential resistance tests on trend appear near the $100.00 round number, then the $106.00 to $108.00 range where a cluster of measured moves appears. Initial support appears near the $86.00 breakout point, then trend support near $82.00.

Coming off of a 52% rally in July out of a Quadruple Top breakout, Advanced Micro Devices (AMD) staged a moderate 10% correction in August. Recently, the shares have resumed their primary uptrend, with yesterday’ breakout over $87.00 completing a bullish Double Top pattern and signaling the start of a new upleg.
Initial upside resistance appears near $100.00 where a vertical count and a round number converge, followed by $110.40 based on a horizontal count. Initial support appears near $83.65 based on a 3-box reversal.
With a perfect SMAX score of 10, AMD is exhibiting near-term strength across the asset classes.
Disclaimer: SIACharts Inc. specifically represents that it does not give investment advice or advocate the purchase or sale of any security or investment whatsoever. This information has been prepared without regard to any particular investors investment objectives, financial situation, and needs. None of the information contained in this document constitutes an offer to sell or the solicitation of an offer to buy any security or other investment or an offer to provide investment services of any kind. As such, advisors and their clients should not act on any recommendation (express or implied) or information in this report without obtaining specific advice in relation to their accounts and should not rely on information herein as the primary basis for their investment decisions. Information contained herein is based on data obtained from recognized statistical services, issuer reports or communications, or other sources, believed to be reliable. SIACharts Inc. nor its third party content providers make any representations or warranties or take any responsibility as to the accuracy or completeness of any recommendation or information contained herein and shall not be liable for any errors, inaccuracies or delays in content, or for any actions taken in reliance thereon. Any statements nonfactual in nature constitute only current opinions, which are subject to change without notice.