


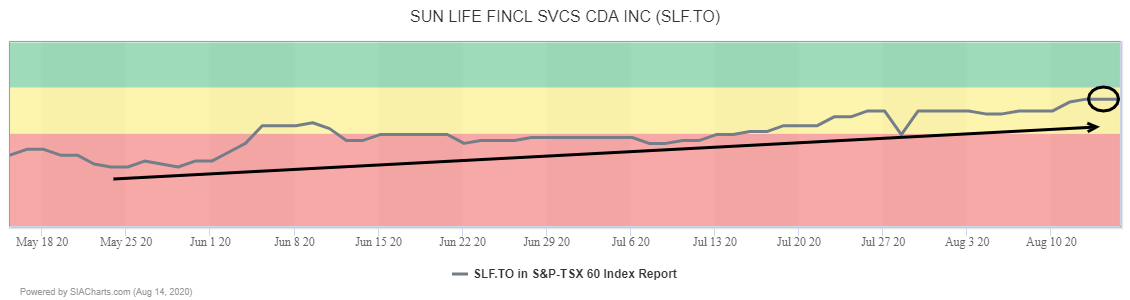
Financial Services provider Sun Life (SLF.TO) sits only 5 spots outside the green Favored Zone after climbing 9 spots over the past month in the neutral zone.
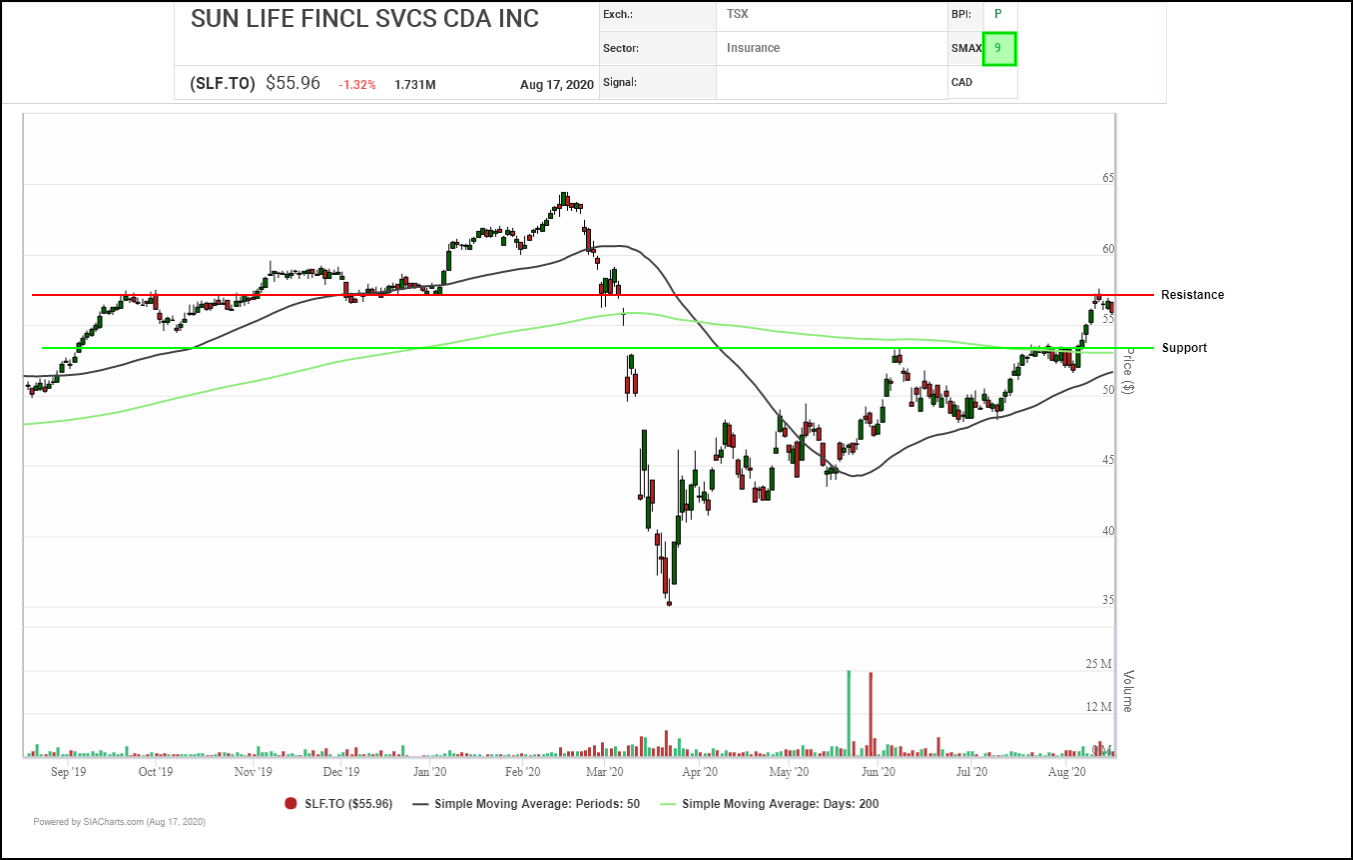
After consolidating sideways in the low $50’s, Sun Life (SLF.TO) pushed higher in short order into the high $50 range, with the 50 day moving average closing in on the 200 day. However, it does appear to have met a touch of resistance. Support may be found at the 200 day moving average, or back down in the low $50s.
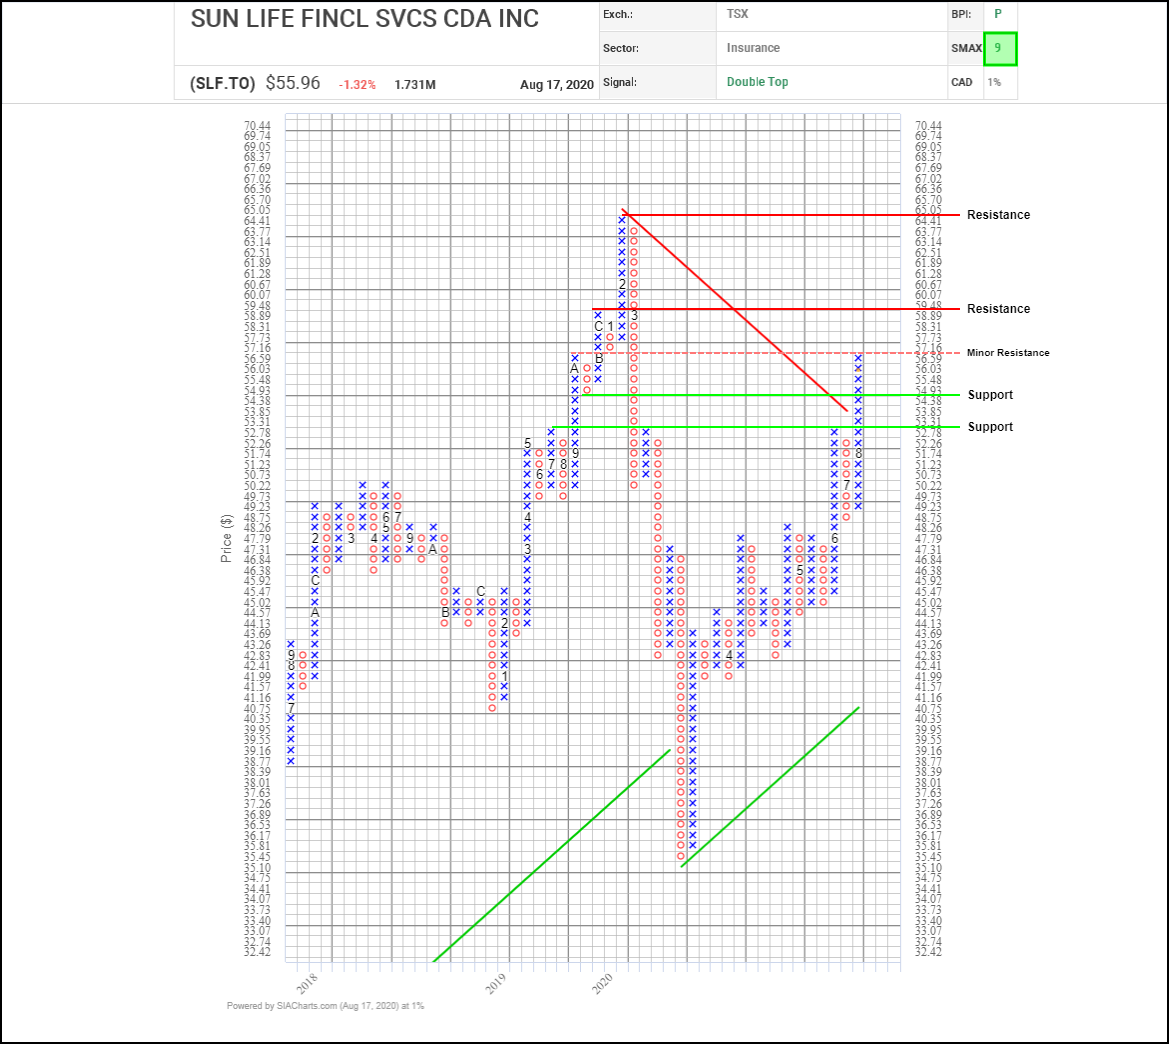
After breaking out to the upside and through a downtrend line on the 1% chart, Sun Life (SLF.TO) sits at $55.96 as of the close on August 17, 2020. Recently accelerating into the high $50’s, SLF.TO seems to have taken a break at minor resistance of $57.16. If selling pressure were to continue, watch for support at $54.38, then again at $52.78. However, if SLF.TO is to resume it’s uptrend, watch for resistance at $59.48, then again right near its all time high in the mid $60 range.
With its bullish SMAX score of 9, SLF.TO is exhibiting near-term strength against the asset classes.
Disclaimer: SIACharts Inc. specifically represents that it does not give investment advice or advocate the purchase or sale of any security or investment whatsoever. This information has been prepared without regard to any particular investors investment objectives, financial situation, and needs. None of the information contained in this document constitutes an offer to sell or the solicitation of an offer to buy any security or other investment or an offer to provide investment services of any kind. As such, advisors and their clients should not act on any recommendation (express or implied) or information in this report without obtaining specific advice in relation to their accounts and should not rely on information herein as the primary basis for their investment decisions. Information contained herein is based on data obtained from recognized statistical services, issuer reports or communications, or other sources, believed to be reliable. SIACharts Inc. nor its third party content providers make any representations or warranties or take any responsibility as to the accuracy or completeness of any recommendation or information contained herein and shall not be liable for any errors, inaccuracies or delays in content, or for any actions taken in reliance thereon. Any statements nonfactual in nature constitute only current opinions, which are subject to change without notice.