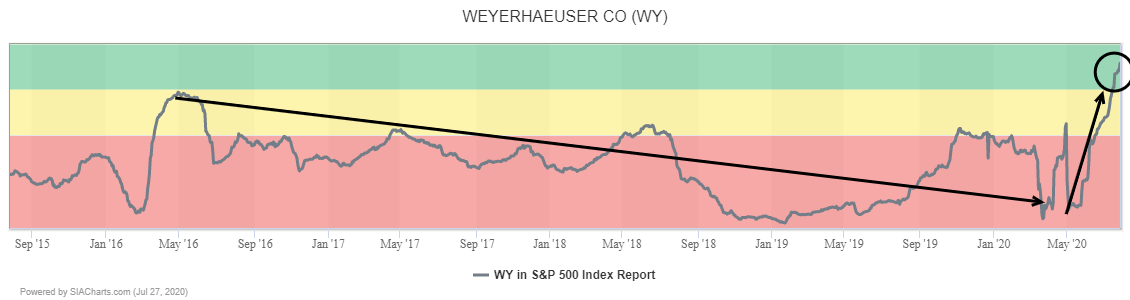
US forest products giant Weyerhauser (WY) recently returned to the Green Favored Zone of the SIA S&P 500 Index Report for the first time in over five years and continues to climb, rising another 20 spots yesterday to 55th place.
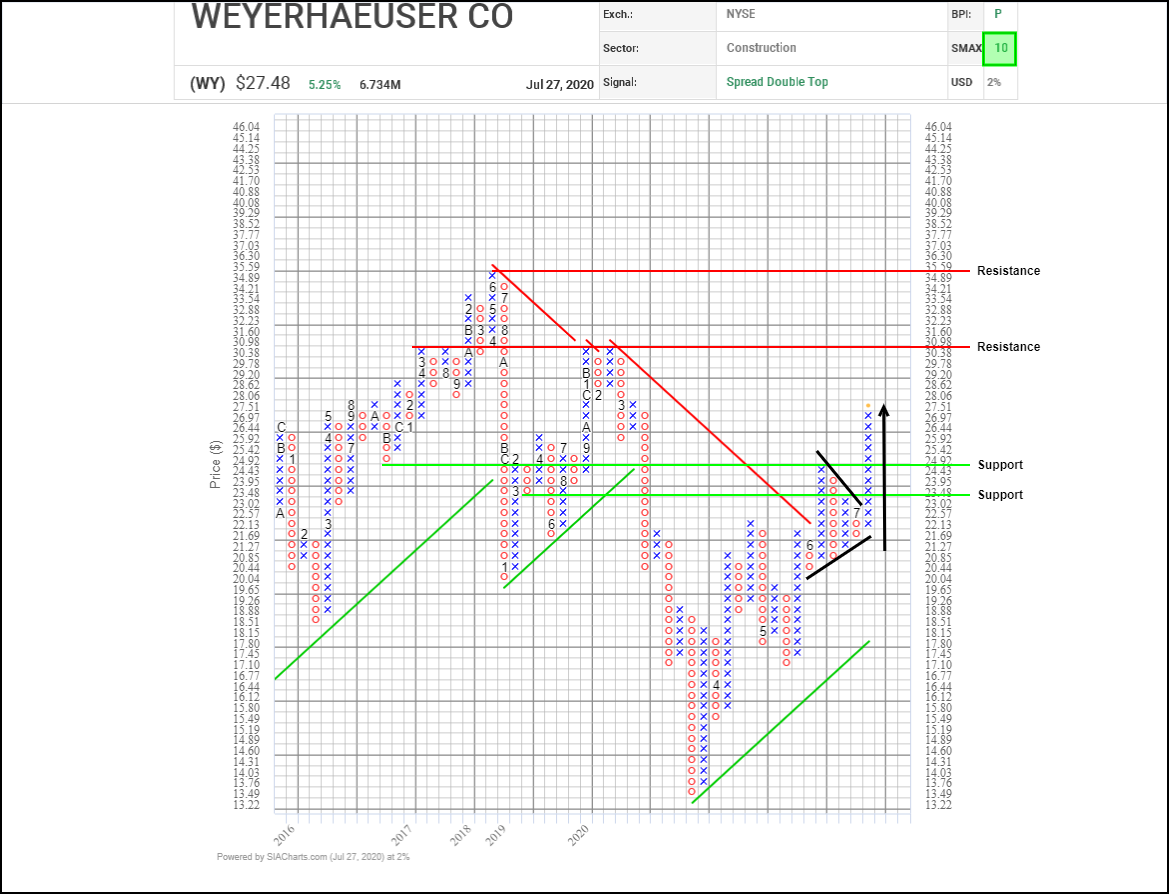
Weyerhauser (WY) has been trending back upward since March, but accumulation has accelerated in recent weeks with the shares’ breakouts over $25.00 and their 50-day average which completed a bullish ascending triangle base. Yesterday, the shares snapped a downtrend line, confirming a new uptrend is underway. Next potential resistance appears between the $30.00 round number and their previous high near $31.00, followed by measured tests near $32.50 and $35.00. The $25.00 breakout point reverses polarity to become initial support.

Weyerhauser (WY) has embarked on a new upleg in recent weeks, breaking out of a symmetrical triangle, completing a bullish Spread Double Top pattern, clearing $25.00 and advancing on $27.50. Next potential upside resistance appears near $31.00 where previous column highs plus vertical and horizontal counts converge, followed by the previous high near $35.60. Initial support appears in the $24.90 to $25.00 area between the previous breakout point and a 3-box reversal.
With a perfect SMAX score of 10, WY is exhibiting near-term strength across the asset classes.
Disclaimer: SIACharts Inc. specifically represents that it does not give investment advice or advocate the purchase or sale of any security or investment whatsoever. This information has been prepared without regard to any particular investors investment objectives, financial situation, and needs. None of the information contained in this document constitutes an offer to sell or the solicitation of an offer to buy any security or other investment or an offer to provide investment services of any kind. As such, advisors and their clients should not act on any recommendation (express or implied) or information in this report without obtaining specific advice in relation to their accounts and should not rely on information herein as the primary basis for their investment decisions. Information contained herein is based on data obtained from recognized statistical services, issuer reports or communications, or other sources, believed to be reliable. SIACharts Inc. nor its third party content providers make any representations or warranties or take any responsibility as to the accuracy or completeness of any recommendation or information contained herein and shall not be liable for any errors, inaccuracies or delays in content, or for any actions taken in reliance thereon. Any statements nonfactual in nature constitute only current opinions, which are subject to change without notice.