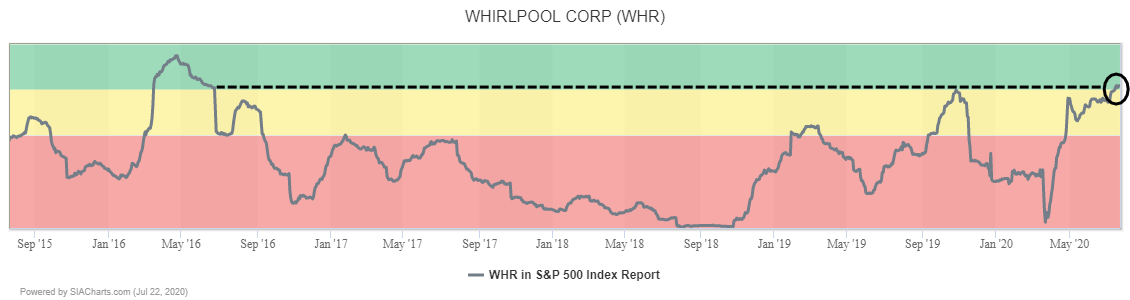
Appliance producer Whirlpool (WHR) recently returned to the Green Favored Zone of the SIA S&P 500 Index Report for the first time since April of 2016 and climbed another 45 spots yesterday to 75th place.

Whirlpool (WHR) continues to climb this week, breaking out over $150 and snapping a long-term downtrend resistance line. The shares are currently bumping up against $160 with next potential resistance on trend at the previous peak near $185, then the $200 round number. Initial support moves up toward $150 from $140.
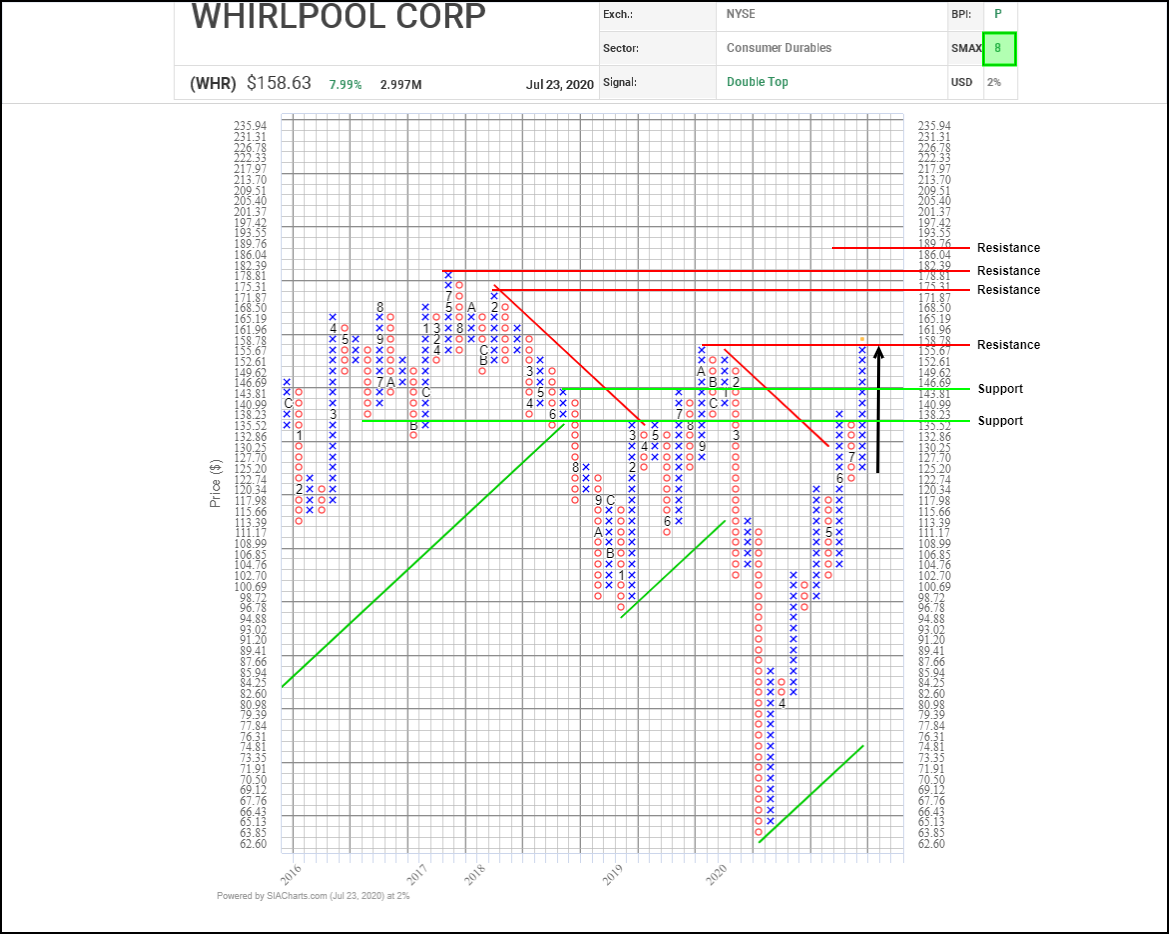
Whirlpool (WHR) shares have been steadily rebounding since March, climbing in a step pattern of advances followed by consolidation at higher levels. This month a new rally phase has started, building on a recent bullish Double Top breakout. Next potential resistance tests on trend appear near $175.30 based on a horizontal count, the previous peak near $182.40, and then $189.75 based on a vertical count. Initial support appears near $146.50 based on a 3-box reversal and old support/resistance points.
With a bullish SMAX score of 9, WHR is exhibiting near-term strength against the asset classes.
Disclaimer: SIACharts Inc. specifically represents that it does not give investment advice or advocate the purchase or sale of any security or investment whatsoever. This information has been prepared without regard to any particular investors investment objectives, financial situation, and needs. None of the information contained in this document constitutes an offer to sell or the solicitation of an offer to buy any security or other investment or an offer to provide investment services of any kind. As such, advisors and their clients should not act on any recommendation (express or implied) or information in this report without obtaining specific advice in relation to their accounts and should not rely on information herein as the primary basis for their investment decisions. Information contained herein is based on data obtained from recognized statistical services, issuer reports or communications, or other sources, believed to be reliable. SIACharts Inc. nor its third party content providers make any representations or warranties or take any responsibility as to the accuracy or completeness of any recommendation or information contained herein and shall not be liable for any errors, inaccuracies or delays in content, or for any actions taken in reliance thereon. Any statements nonfactual in nature constitute only current opinions, which are subject to change without notice.