


With a 12.9% gain in the last week, medical implant producer Abiomed (ABMD) has moved back up to top spot in the Green Favored Zone of the SIA S&P 500 Index Report.
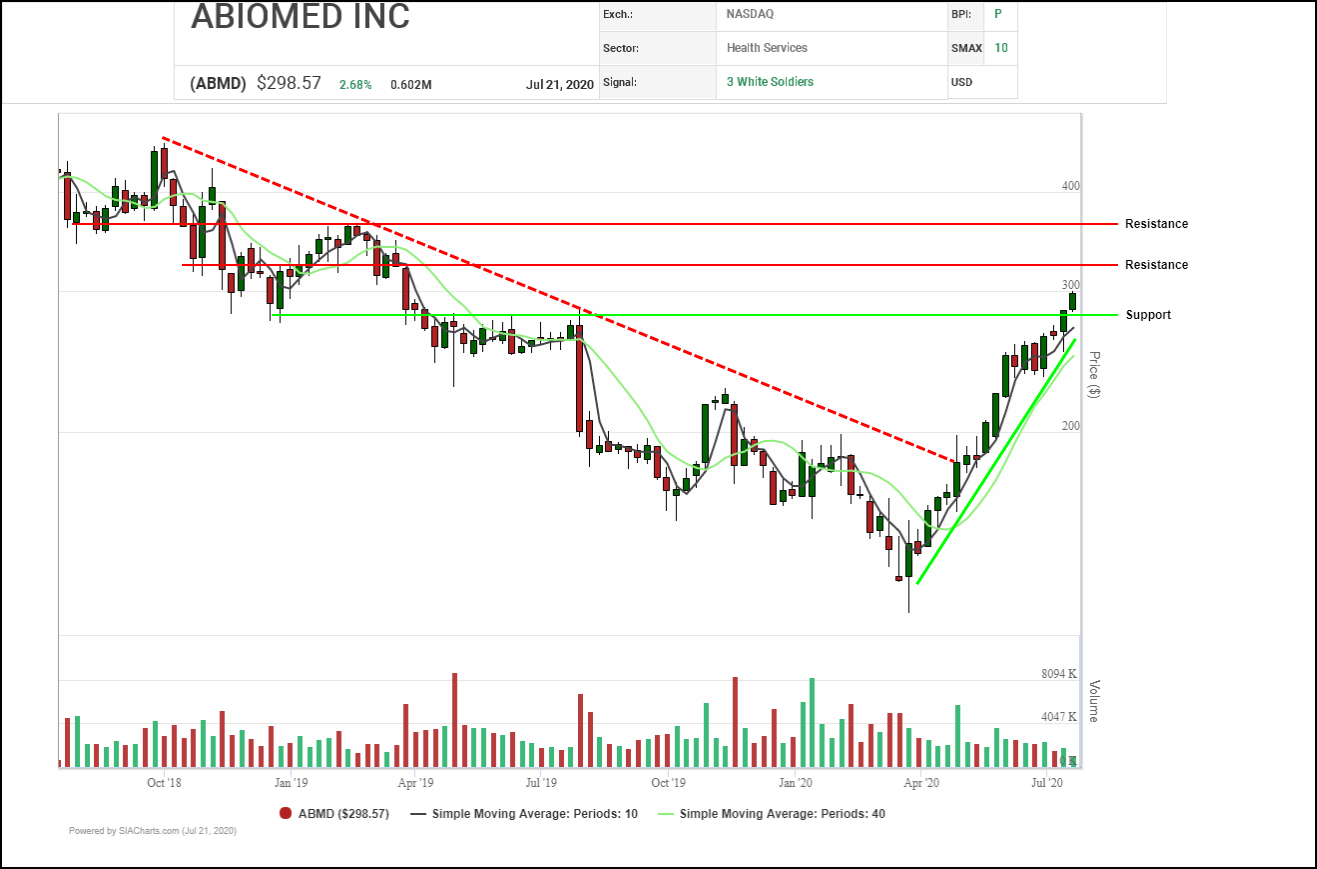
Since bottoming out in March, Abiomed (ABMD) shares have been under accumulation, establishing an uptrend of higher lows, staging multiple pattern breakouts and completing a bullish Golden Cross on their way from near $130 toward $300. Next potential resistance appears near $320 where multiple measured moves converge, followed by previous support/resistance near $340 and $360. Initial support appears near $280, a previous resistance level.
Abiomed (ABMD) shares have been under strong accumulation since March, advancing from near $130 toward $300 with only one 3-box correction along the way. Earlier this month, the shares completed a bullish Double Top breakout which signaled the start of the current upleg.

A breakout over $301.50 would confirm continuing investor interest with next potential resistance on trend in the $339.50 to $346.25 area where a horizontal count and previous column high converge, followed by $367.45. Initial support appears near $273.00 based on a 3-box reversal.
With a perfect SMAX score of 10, ABMD is exhibiting near-term strength across the asset classes.
Disclaimer: SIACharts Inc. specifically represents that it does not give investment advice or advocate the purchase or sale of any security or investment whatsoever. This information has been prepared without regard to any particular investors investment objectives, financial situation, and needs. None of the information contained in this document constitutes an offer to sell or the solicitation of an offer to buy any security or other investment or an offer to provide investment services of any kind. As such, advisors and their clients should not act on any recommendation (express or implied) or information in this report without obtaining specific advice in relation to their accounts and should not rely on information herein as the primary basis for their investment decisions. Information contained herein is based on data obtained from recognized statistical services, issuer reports or communications, or other sources, believed to be reliable. SIACharts Inc. nor its third party content providers make any representations or warranties or take any responsibility as to the accuracy or completeness of any recommendation or information contained herein and shall not be liable for any errors, inaccuracies or delays in content, or for any actions taken in reliance thereon. Any statements nonfactual in nature constitute only current opinions, which are subject to change without notice.