by Bryce Coward, CFA, Knowledge Leaders Capital
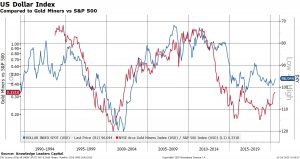
With the US dollar index recently having completed a so called “death cross”, we thought it would be a good opportunity to review the investment implications of a potential trend change in the USD. The “death cross” is a technical chart formation in which the 50-day moving average passes under the 200-day moving average. It is a simple measure of trend, but one that historically has preceded further weakness in the USD.
The “death cross” comes at a time when some fundamental forces seem to be suggesting a more durable downtrend in the USD is possible, as opposed to just a short-term reversal in trend. For example:
- The US budget deficit as a percent of GDP may reach a new record in 2020 at 15-17%. The budget deficit as a percent of GDP is highly correlated with the level of the USD in that wider budget deficits are associated with a weaker currency.
- The Federal Reserve has clearly signaled that it does not intend to raise rates until 2023 at the earliest, as the “dot plot” of individual Fed governors’ projections suggests. More Fed ease may also be on the way in the form of forward guidance, yield curve control, an inflation symmetry target, and/or a more permanent quantitative easing program. All else equal, these items support the case for a weaker currency.
- The question is weak against what? In our view the euro is one contender. As the 4th chart below shows, the interest rate differential between the Fed Funds rate and the ECB deposit rate is no longer supportive of the USD since that differential has moved from 2.75% to just 0.75% in a matter of a few months’ time.
- Furthermore, the Fed (so far) appears is creating more money than the ECB in its response to the COVID crisis. That is, the money supply in the US is growing faster than the money supply in Europe. This dynamic is supportive of a stronger euro vs the USD (see chart 5 below).
- Finally, the unemployment rate in the US is quickly moving to parity with the Eurozone (see chart 6 below). In the past, as the unemployment rate differential between Europe and the US has closed, the euro has strengthened vs the USD.
Given the above, the likelihood of a weaker USD, against the euro and other currencies, seems more probable than in years past. This too is before even considering the implications of a more solidified political union within Europe. As such, examining the asset allocation implications of a weaker USD makes sense at this point, even if the trend is not fully entrenched yet.
In the charts below, we highlight 10 major implications of a weaker USD scenario. In each chart, we plot the DXY index in blue on the right, inverted axis. In this way, when the blue line goes up, it represents a weaker USD. We then plot the relative asset comparison in red on the left axis.
There are several takeaways that are most important from this exercise:
- Technology, which has been THE leadership group over recent years, is highly unlikely to continue to lead if the USD weakens on a secular basis
- Areas of the equity market where investors are most underweight (value, international, smaller companies, EM) tended to do the best in a falling USD environment
- Hard assets outperformed stocks in falling USD periods
- Credit outperformed stocks in falling USD periods
Therefore, to the extent a falling USD becomes a reality, investors may need to pay attention to and re-familiarize themselves with those areas of the capital markets that have been out of favor (both nominally and relative to US large cap stocks) for the better part of a decade.
10 Implications of a Weak USD Scenario
1) Cyclical over defensive stocks. A weaker USD is often associated with rising inflation expectations and faster nominal GDP growth. Companies with high levels of operating leverage (i.e. those companies that are able to raise revenues without raising costs as fast) experience expanding profit margins when either nominal economic growth rises or they can pass along higher input costs to end customers. The materials sector is the epitome of this and the industrials sector is not far behind. At the opposite end of the spectrum are utilities and technology, which have much lower levels of operating leverage in general – the utes because of lack of pricing power and the tech stocks because of lower levels of fixed assets. One exception to this generality is the relationship between the consumer staples sector (a traditional defensive space) and the consumer discretionary sector (a more cyclical area). Staples companies tend to have more pricing power and thus greater operating leverage than do discretionary companies in a period of a falling USD/rising inflation expectations, since the products they sell are less substitutable.
2) Value over growth stocks. An extension of item #1 is the generalized outperformance of value vs growth in falling USD periods, and for many of the same reasons. One caveat to this however, is the financials sector, which is typically associated with “value”. In previous periods of significant USD weakness, financials have done quite well on a relative basis in part because the yield curve tends to steepen (i.e. the long end rises faster than the short end as inflationary outcomes are discounted). Steeper yield curves are good for bank profits since they borrow short and lend long. However, in a world of financial repression and yield curve controls, the yield curve may be highly unlikely to steepen much at all, thus rendering bank profitability semi-permanently impaired in aggregate. Japanese and European banks are the case studies for this.
3) Small over large stocks. The small cap indexes tend to be more “value” oriented simply due to compositional differences compared to the S&P 500. Smaller stocks are also more cyclical than large stocks and often have significant built-in operating leverage. In a weak USD environment, we believe it makes sense to move down the cap scale, whether that be increasing one’s allocation to small cap indexes or substituting capitalization weighted exposure for equal weighted exposure. One benefit of the latter is that it may actually improve a portfolio’s risk profile insofar as exposure to a very few number of enormous capitalization stocks is mitigated.
4) Foreign over US stocks. Foreign stocks, due to compositional differences from US large cap stocks, benefit from similar dynamics described above. They also benefit from the currency appreciation component of a falling USD/rising local currency.
5) Emerging markets over foreign developed stocks. Many emerging market economies are setup in a pro-cyclical way, which is the opposite of the US economy. This is because inflation tends to be higher among EM countries, they oftentimes have large balance of payments deficits (meaning they need to import capital from abroad), the debt they assume is often denominated in USD or another currency they can neither print or earn revenues in, and they often produce commodities. Below I outline a typical pro-cyclical sequence of events for an emerging market country, which should highlight why these stocks could do well in falling USD periods.
-
- Local currency rises
- Foreign denominated debt becomes easier to repay, increasing corporate and sovereign cash flows
- Imported inflation goes down from the rising local currency, which raises corporate and household cash flows
- Commodity prices in USD terms rise, raising corporate cash flows in local currency terms
- The central bank is able to cut interest rates due to lower inflation
- Growth accelerates because of central bank rate cuts
- Growth accelerates because of increased investment from the newly created excess domestic savings
- The better debt and growth profile causes the local currency to appreciate even further, attracting investment from abroad
- Rinse and repeat
EM not only outperformed US stocks in falling USD periods, but also foreign developed stocks too.
6) Within EMs, favor the countries that are the most pro-cyclical (i.e. those with typically higher inflation and balance of payments deficits) tended to do best in falling USD periods.
7) Precious metals & real assets over stocks. Little explanation needed in terms of the precious metals complex or TIPS. However, it’s important not to lump all commodities together. For example, soft commodities have largely underperformed US large stocks (and just gone down in general) regardless of the direction of the USD.
8) Copper over gold. Copper has tended to outperform gold in periods of USD weakness, perhaps because copper benefits from both rising inflation and real growth.
9) Credit over stocks. To the extent that higher corporate revenues from inflation pass-through makes debt servicing easier, credit benefited from USD weakness.
10) High yield credit over investment grade credit. Among credits, the most accurately indebted companies have fared the best in periods of USD weakness.
Copyright © Knowledge Leaders Capital


