Clothing retailer L Brands (LB) is climbing within the Green Favored Zone of the SIA S&P 500 Index Report again, moving up 27 spots yesterday to 37th place.
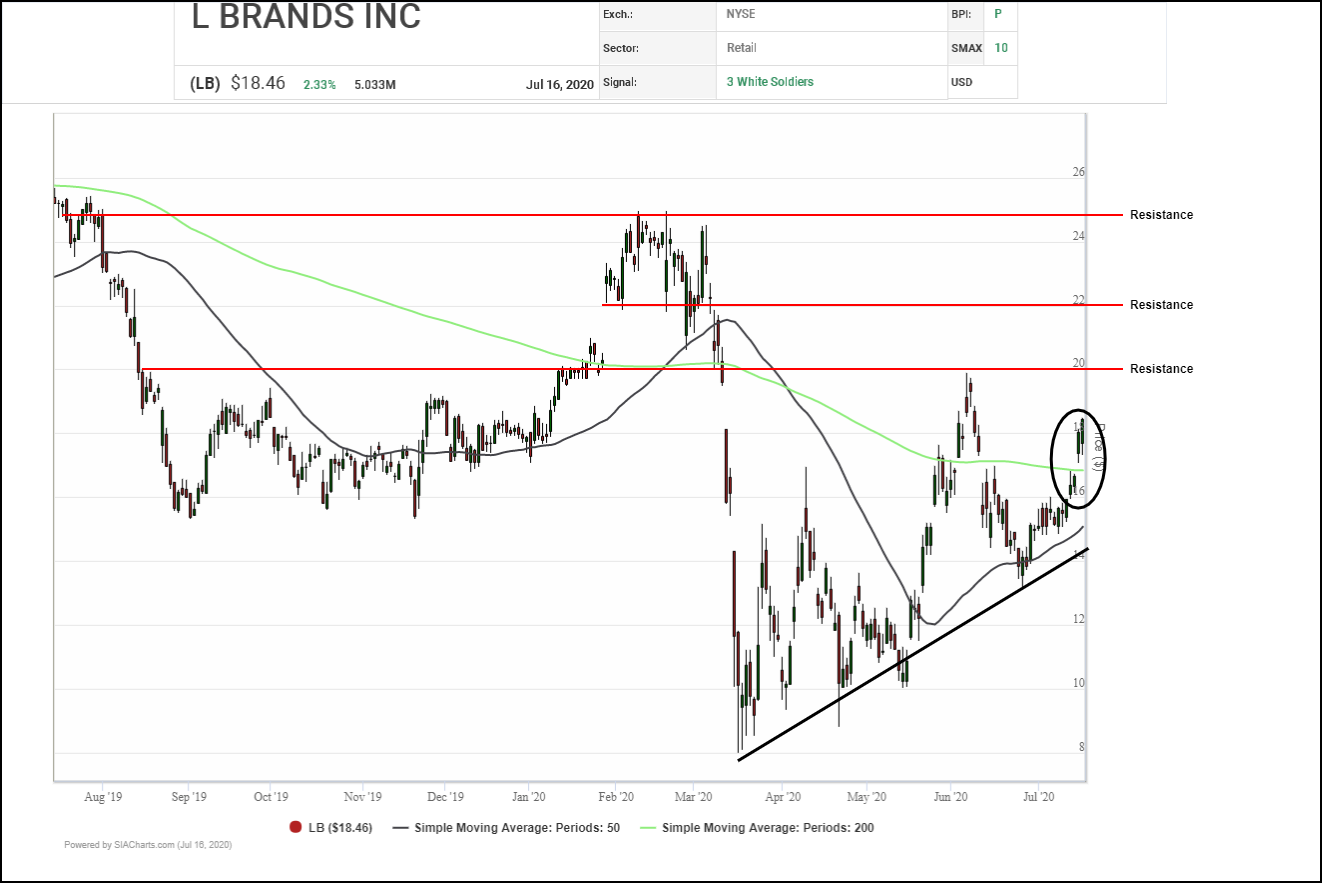 L Brands (LB) has resumed its recovery trend following a trading correction. This week, the shares gapped up through their 200-day average and have continued to climb, indicating increased investor interest. Having regained $1800, next potential resistance appears on trend at the previous high near $20.00, the top of an old gap near $22.00 and the February peak near $25.00. Initial support appears at the 200-day average near $16.80.
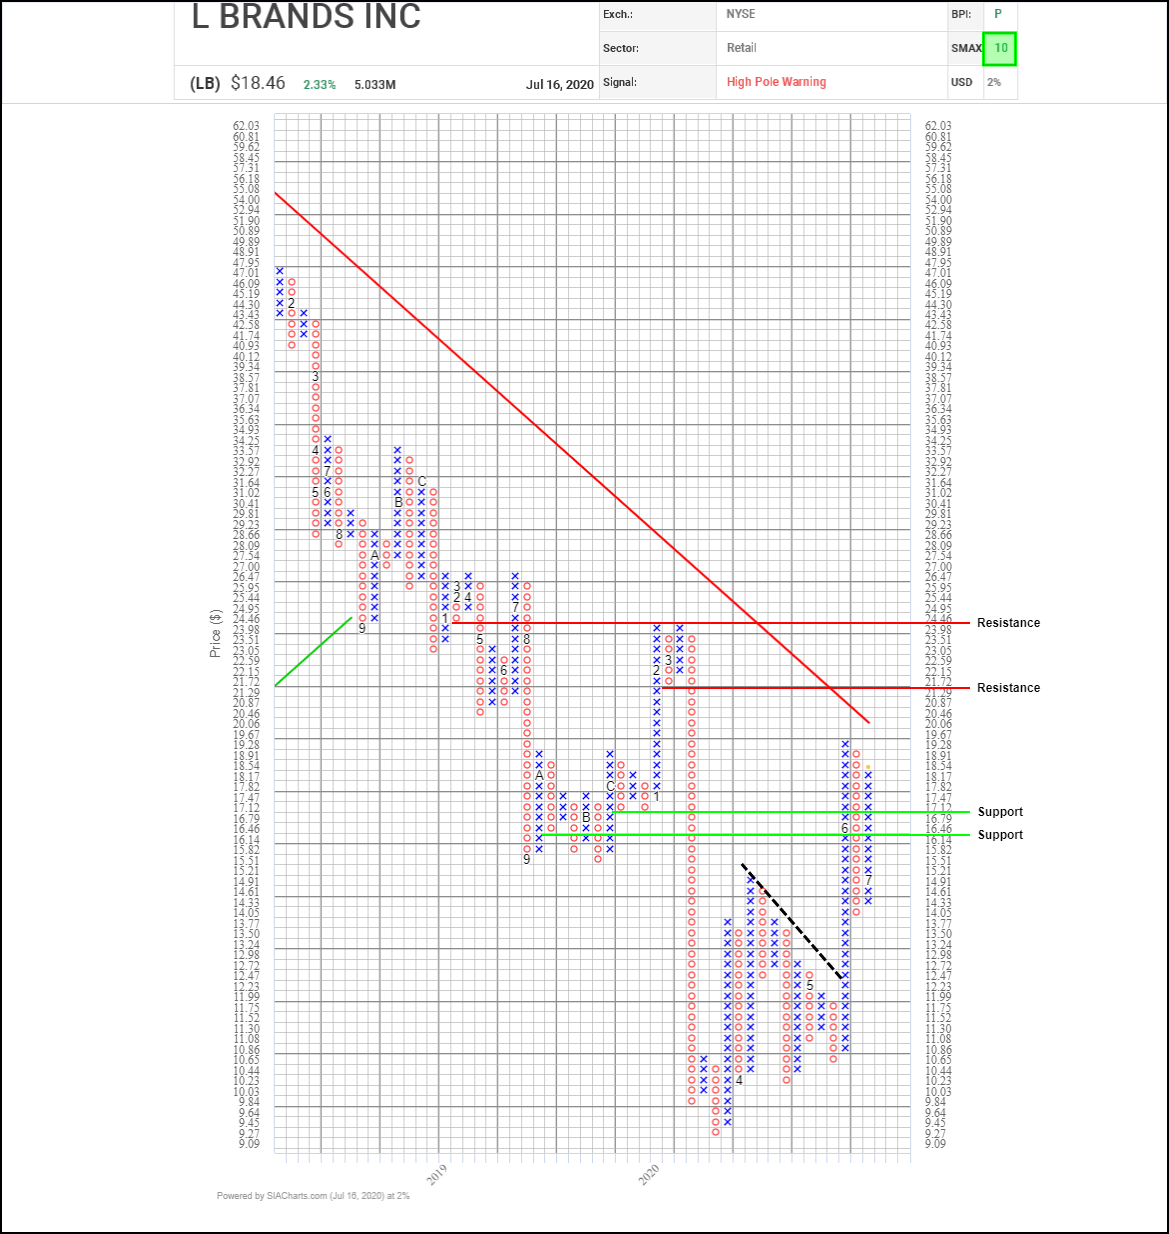 Accumulation in L Brands (LB) has accelerated since May, when they broke out of a downtrend and turned decisively upward. A recent correction bottomed out at a higher level and a symmetrical consolidation triangle has started to form in a higher range between $14.00 and $20.00. Initial resistance appears in the $19.65 to $20.00 area where a round number, previous high and downtrend line converge. A breakthrough there would signal the start of a new upleg with next potential resistance near $21.75 then $24.50, the boundaries of a previous trading range. Initial support appears near $16.80 based on a 3-box reversal.
With a perfect SMAX score of 10, LB is exhibiting near-term strength across the asset classes.


