


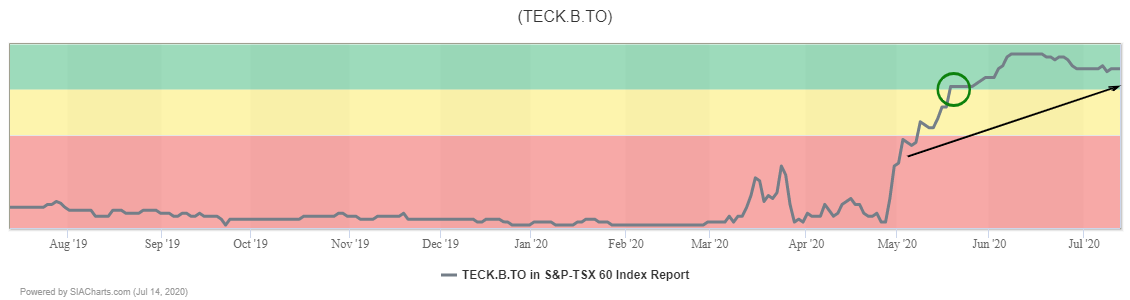
Teck Resources (TECK.B) remains in the Green Favored Zone of the SIA S&P/TSX 60 Index Report, where it has been holding since moving up from the Red Zone back in May, and is currently holding down 9th place.
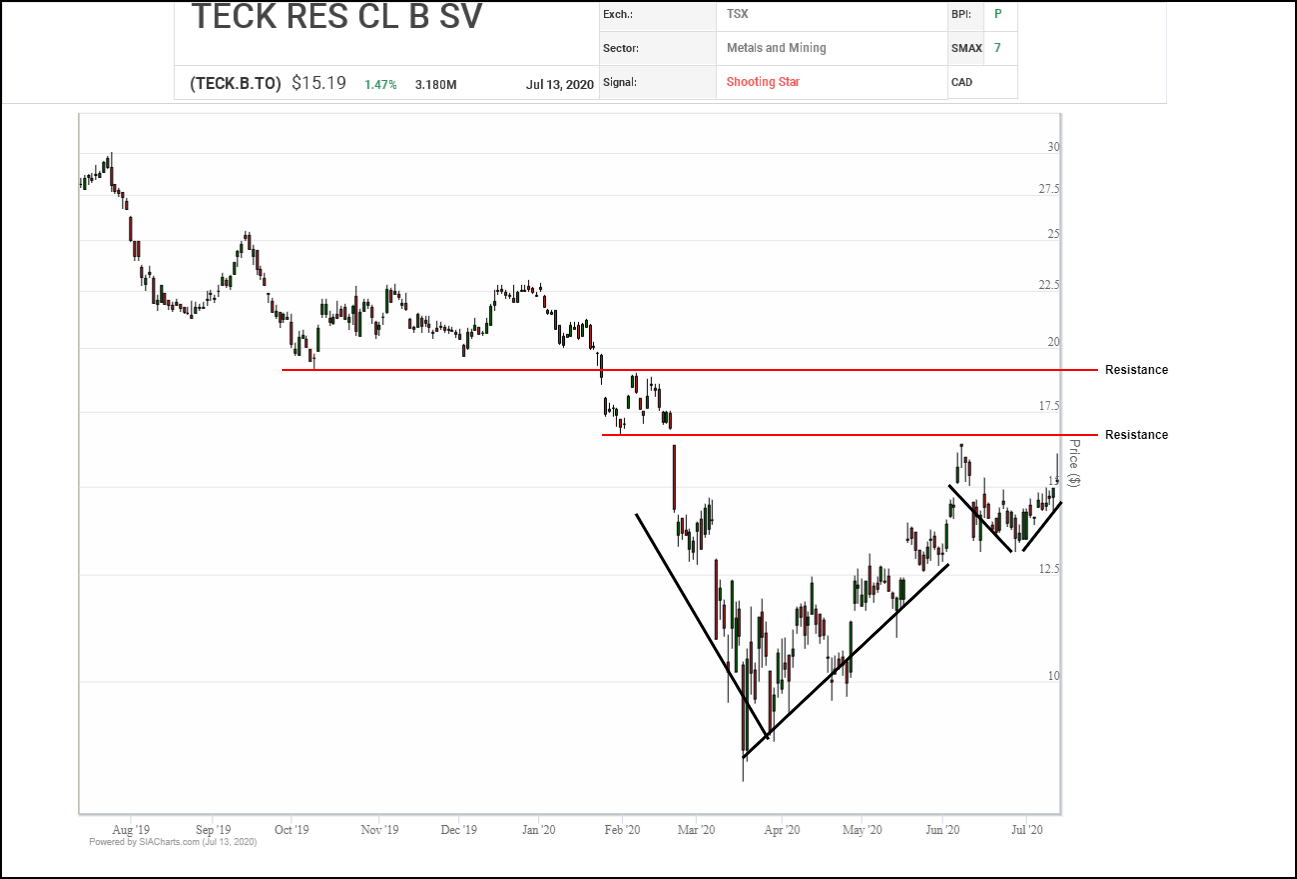
In rallying up off of a successful retest of support at its 50-day average near $13.00, Teck Resources (TECK.B) appears close to completing a bullish cup-with-handle base consisting of a large saucer bottom followed by a smaller, higher rounded bottom. A breakout over $16.00 would complete the base and confirm the start of a new uptrend with next potential resistance near $19.00 based on a measured move and previous support/resistance, followed by the $20.00 round number.
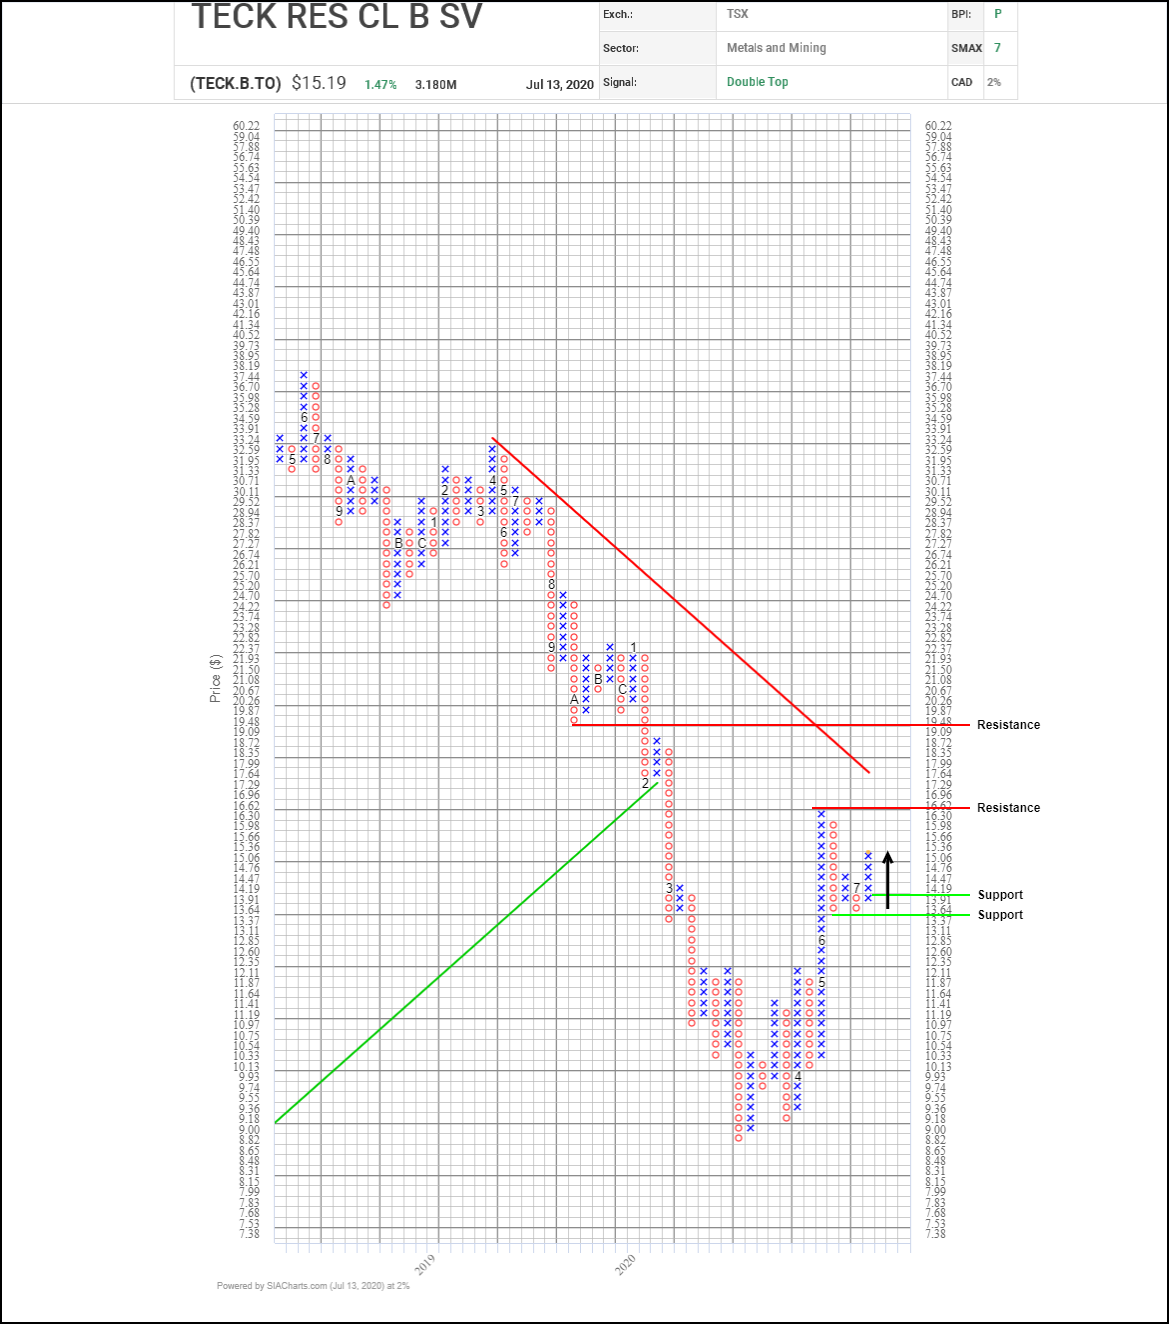
 A few weeks ago, TECK.B successfully retested $13.35 support. This month, the shares have resumed their recovery trend, completing a bullish Double Top pattern on their way back up above $15.00. Initial upside resistance appears at a previous high near $16.60 where a breakout would complete a bullish Spread Double Top pattern, followed by a downtrend line near $18.00, then the $19.50 to $20.00 area where a horizontal count, previous support and a round number all converge. Initial support moves up toward $13.90 based on a 3-box reversal.
With a bullish SMAX score of 7, TECK.B is exhibiting near-term strength against the asset classes.
Disclaimer: SIACharts Inc. specifically represents that it does not give investment advice or advocate the purchase or sale of any security or investment whatsoever. This information has been prepared without regard to any particular investors investment objectives, financial situation, and needs. None of the information contained in this document constitutes an offer to sell or the solicitation of an offer to buy any security or other investment or an offer to provide investment services of any kind. As such, advisors and their clients should not act on any recommendation (express or implied) or information in this report without obtaining specific advice in relation to their accounts and should not rely on information herein as the primary basis for their investment decisions. Information contained herein is based on data obtained from recognized statistical services, issuer reports or communications, or other sources, believed to be reliable. SIACharts Inc. nor its third party content providers make any representations or warranties or take any responsibility as to the accuracy or completeness of any recommendation or information contained herein and shall not be liable for any errors, inaccuracies or delays in content, or for any actions taken in reliance thereon. Any statements nonfactual in nature constitute only current opinions, which are subject to change without notice.