by Brooke Thackray, Alphamountain Investments
 Every so often one word, or term, drives the narrative and dominates the financial media. In 2009, the US Federal Reserve Chairperson Ben Bernanke used the term “green shoots” to describe the early positive signs of an improving economy. The term caught on like wild-fire and was repeated ad nauseam in the media.
The Covid-19 crash and subsequent recovery in the stock market has been the genesis of the term “V-shaped recovery.” Investors and the media have constantly debated if it was possible for the stock market or the economy, or both to have a “V-shaped rally.” Other letters such as “U” or “W” have also been enlisted to describe possible future economic or stock market action. Some have gone as far as symbolizing the economic recovery in the shape of a square root sign, or a reverse square root sign.
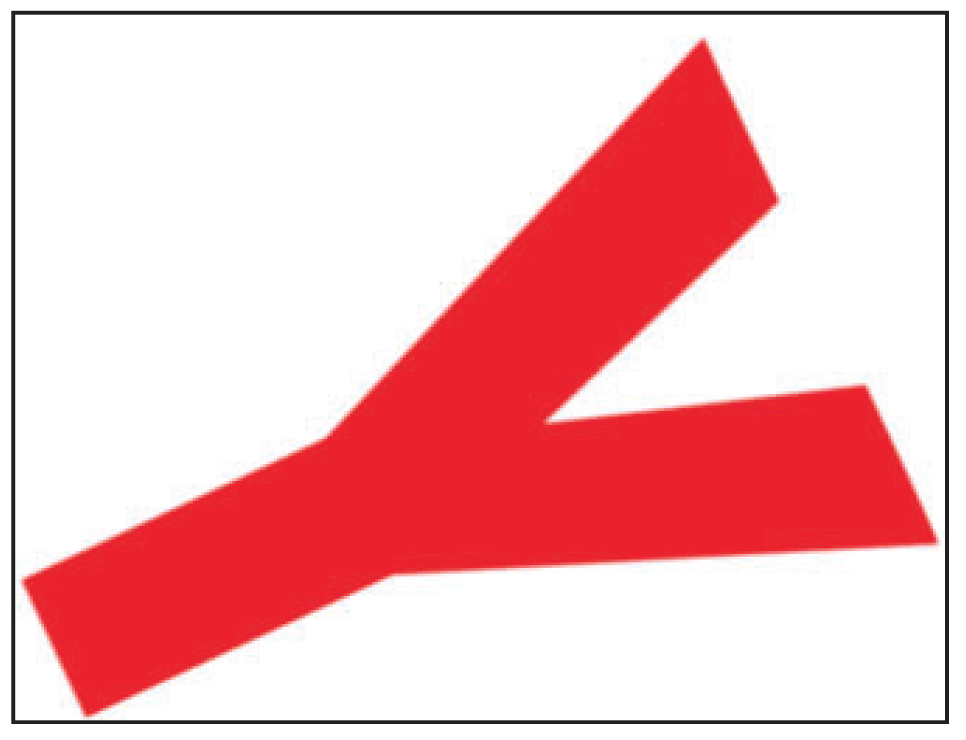
To add a novel twist, I am postulating that the re-opening of the economy is forming the shape of a “Leaning Y.”
After massive injections of liquidity into the markets by the Federal Reserve in March, the stock market managed to stop its free-fall and rally. Expectations of a rebounding economy ensued and the economy started to show signs of improvement. It quickly became apparent that the stock market’s performance did not match the economic growth. The Nasdaq has rallied to all-time highs and the S&P 500 has rallied to levels not too far from the start of the year.
The stock market is represented by the top branch of the “Leaning Y”. After a self-imposed lock-down the economy has been re-opening and some economic numbers are showing signs of improvement. Economic improvement has been much slower than the rallying stock market performance: Hence the bottom of the “Leaning Y” represents the progress of the economic improvement.
The bifurcation between the performance of the stock market and the economy is not debatable. The rationale for the difference is twofold. First, the stock market is a forward-looking mechanism. Many pundits claim that it looks out six to nine months. As a result, a better performing stock market is a natural occurring event when the economy is bouncing off a bottom. Second, increased liquidity in the markets as the result of Federal Reserve loose monetary policy is providing funds to drive the stock market higher.
The above formula is a conceptual representation of the current dynamics in the market. It is not possible to quantify, especially given the massive and quickly implemented amount of Federal Reserve stimulus. The Federal Reserve balance sheet has grown from approximately $4 trillion Pre-Covid, to over $7 trillion.
The problem is that the “Leaning Y” is really an alligator waiting to bite.
An alligator can hang around on the bank of a river with its mouth remaining open for an extended period of time. Eventually, it has to close its jaws.
In context of the stock market versus the economy, the alligator can keep its jaws open longer, but at some point, either the economy must grow at a faster rate or the stock market must slow its acceleration.
If the stock market was fairly valued on February 19, 2020 and the stock market is able to trade at the same level today as it was in February, the economy should be in approximately the same state, give or take. The problem is that economy is in significantly worse shape.
The current bet in the stock market is that either the stock market was undervalued in February and deserves a higher multiple expansion (higher P/E) than previously existed, or investors are willing to assume a greater time risk than they have previously been willing to pay. The time risk is the willingness to accept poor absolute economic performance in the near future for better growth in the future. The increased liquidity in the markets by the Federal Reserve provides the fuel for investors to express their optimistic positioning.
In March, analysts were developing economic forecasts with little vision into the future. The results were pessimistic forecasts which recently have been exceeded on a fairly regular basis. Beating grossly pessimistic economic forecasts does not mean that the economy is set to continue to expand to previous levels (and beyond). There is a sense that the inertia of economic improvement will carry the economy on an ever upward trajectory.
The growth rate of the economy bouncing from the bottom in late March is not a reliable indicator of future growth. A change from close to a zero bound level is distorted because a small level of absolute change results in a large percent rate of change. The standard of error is huge. It is only after time and a movement away from proximity to a zero bound level that a rate of change in economic growth can become a meaningful indicator for possible future growth. Currently, according to electionbettingodds.com, Biden is in the lead, but we all know that polls are notoriously unreliable.
Recent economy reports have been beating expectations on a fairly consistent basis, but it would be wise not to extrapolate current trends in to the future with blind faith.

The Citigroup Economic Surprise Index is a diffusion index measuring economic report outcomes versus their expectations. Clearly, the economy has been performing better than expected. Nevertheless, the past trend does not ensure the same of the future. Setting expectations is a dynamic process as they are constantly reset. It is possible that the Citigroup index could turn lower in the near future.
Earnings expectations – maybe too optimistic?
Earnings season is fast approaching.
The US Financial companies kick offthe Q2 earnings season on Tuesday July 14. Currently, the expectations for earnings for the S&P 500 companies is a decrease of 44% on a year over year basis.

If you look at the chart provided by Refinitiv, you can see that Q2 in 2021 is the anomaly on the upside that is the adjustment on a year over basis from the current earnings season.
Oh Yeah! There is an election coming up
It seems with everything going on many people have forgotten that the US has a Presidential election coming up on November 3.
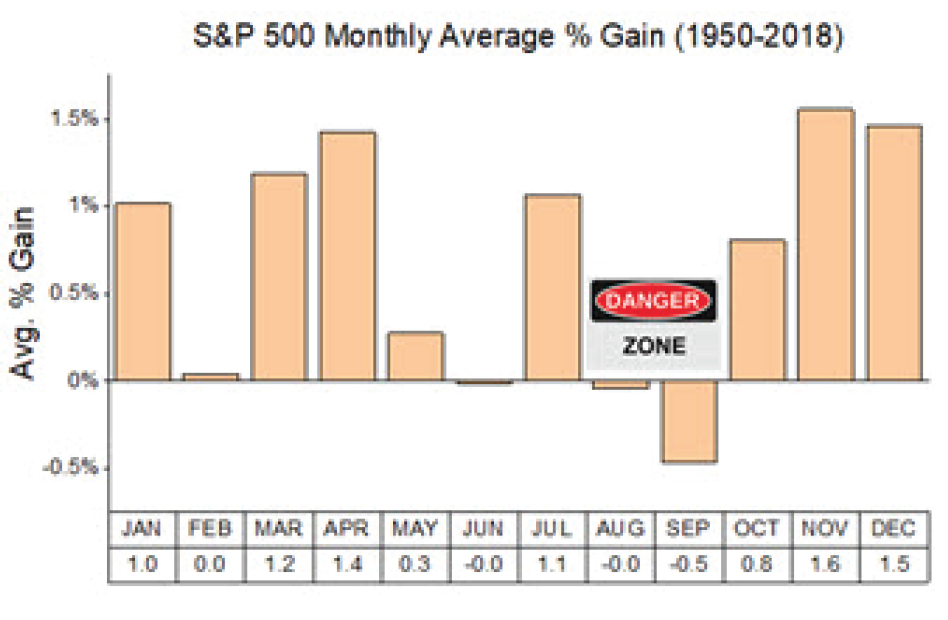
In my next newsletter, I will look more closely at the election cycle and the average performance of the stock market in the election year. Hint: the stock market tends to perform poorly in August, September and into October.
Warning - Seasonal Danger Zone
The stock market bounced in late March and has rallied since the beginning of May. Historically, the stock market can perform well in May and June if the economy is expanding rapidly and the stock market has strong momentum. I discussed this in my first book Time In Tim Out: Outsmart the Stock Market Using Calendar Strategies, released in 1999.
Nevertheless, on average, August and September have been the two worst contiguous months of the year over the long-term. Something to think about. I will write about this seasonal phenomenon in my next newsletter.
Copyright © Brooke Thackray


