by Talley Leger, Invesco Canada
In response to numerous client questions about portfolio positioning for a recovery scenario, we provide a historical perspective on stock market, sector, size, style and regional allocations. Also, we juxtapose typical recovery performance trends against recent price action.
At present, we observe that some performance trends – for now, at least – do hint at a potential recovery, including the recent outperformance of stocks relative to bonds, cyclical sectors relative to defensive ones and small market capitalization stocks relative to their large counterparts.
However, some other trends suggest it may be too soon to expect a durable change in leadership, namely in the form of growth continuing to outperform value and developed markets still outperforming their emerging competitors.
Whether the recovery began a month ago or it begins a month or more from now, we help investors look across the valley to better times ahead and position their portfolios for optimistic, long-term outcomes.
1. Asset allocation – stocks outperform bonds (yes)
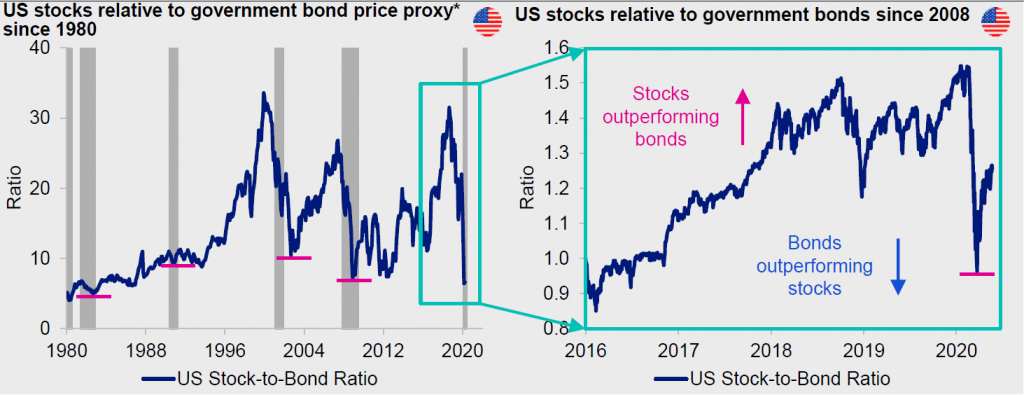
The first chapter of our “recovery playbook” covers the stock-to-bond ratio – a measure of investor risk-on positioning when the ratio is in an uptrend or risk-off positioning when it’s in a downtrend.
Specifically, stocks – more aggressive, pro-cyclical assets – began persistently outperforming bonds – safer, income-oriented assets – near the last four economic recessions.
Currently, stocks have been sharply beating bonds since the March 2020 low, which is consistent with the typical recovery performance trend.
Figures 1 & 2. Stocks began persistently outperforming bonds near the last four economic recessions.
Source: Bloomberg L.P., Invesco, 05/21/20. Notes: Price indices. Cyclicals = Consumer Discretionary, Energy, Financials, Industrials, Information Technology and Materials. Defensives = Consumer Staples, Health Care, Telecommunication Services and Utilities. Shaded areas denote National Bureau of Economic Research (NBER)-defined U.S. recessions. An investment cannot be made in an index. Past performance does not guarantee future results.
2. Sectors – cyclicals outperform defensives (yes)
Trends within the stock market also reflect the success or failure of the recovery trade.
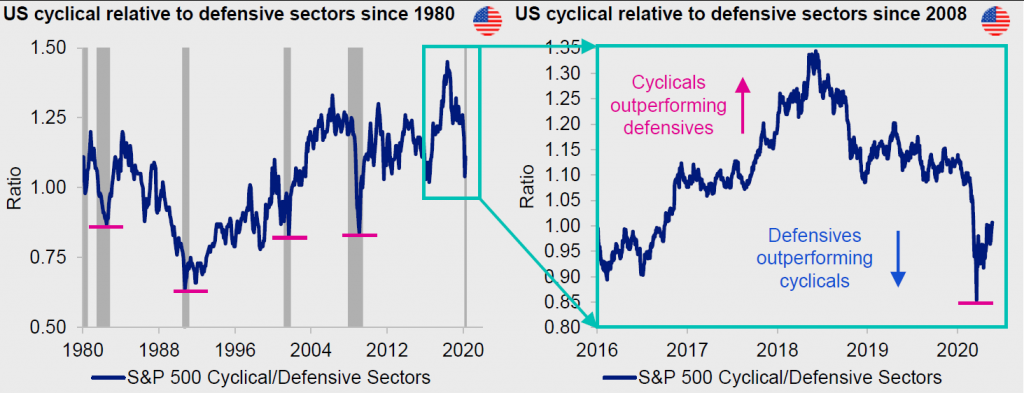
Intuitively, the economy-sensitive sectors of the stock market (e.g., consumer discretionary, energy, financials, industrials, information technology and materials) led the charge exiting the early-1980s, 1990s, 2000s and late-2000s business cycle downturns.
Contrastingly, the defensive market segments (e.g., consumer staples, health care, telecommunication services and utilities) lagged in the same timeframe.
Encouragingly, the cyclical-to-defensive ratio bottomed in March 2020 and cyclicals are generally behaving the way we’d expect in a recovery scenario.
Figures 3 & 4. The economy-sensitive sectors of the stock market led the charge exiting the early-1980s, 1990s, 2000s and late-2000s business cycle downturns, whereas the defensive market segments lagged in the same timeframe.
Source: Bloomberg L.P., Invesco, 05/21/20. Notes: Price indices. Cyclicals = Consumer Discretionary, Energy, Financials, Industrials, Information Technology and Materials. Defensives = Consumer Staples, Health Care, Telecommunication Services and Utilities. Shaded areas denote NBER-defined U.S. recessions. An investment cannot be made in an index. Past performance does not guarantee future results.
3. Size – small caps outperform large caps (yes)
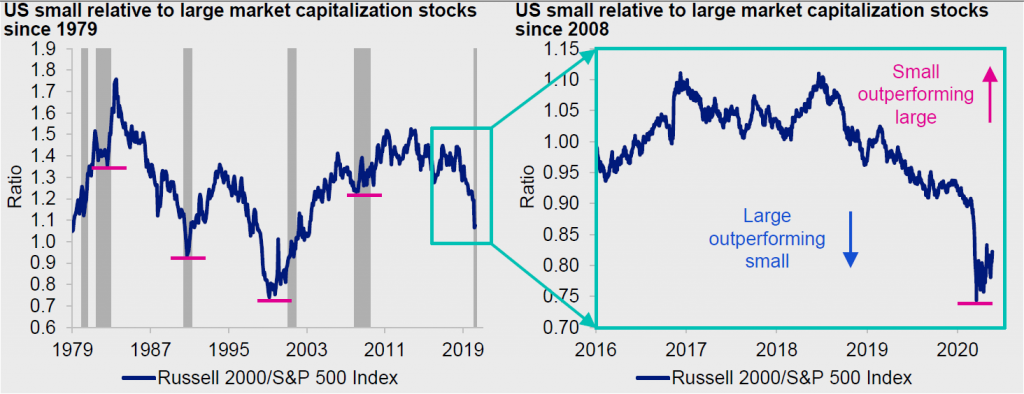
In the past, equity portfolios with a small market capitalization tilt (favouring high-growth companies and riskier, less-liquid stocks) usually outperformed those with a large-cap bias (emphasizing stable, high-quality companies and liquid stocks) for several years into the recovery stage of the business cycle. Said differently, company size was a play on improving economic prospects.
Initially, small caps gain traction in an environment of abundant central bank liquidity, improving credit conditions, tightening credit spreads, ebbing volatility, shrinking risk premia, as well as investors’ penchant for cyclicality and thirst for higher returns. Sound familiar?
The next stage of small-cap outperformance may likely require the support of an expanding economy, rebounding corporate profits and declining default rates.
As for large caps, they generally do well in the mid to late stages of the business cycle, but those times are clearly behind us.
Figures 5 & 6. In the past, equity portfolios with a small market capitalization tilt usually outperformed those with a large-cap bias for several years into the recovery stage of the business cycle. Said differently, company size was a play on improving economic prospects.
Source: Bloomberg L.P., Invesco, 05/21/20. Notes: Price indices. Shaded areas denote NBER-defined U.S. recessions. An investment cannot be made in an index. Past performance does not guarantee future results.
4. Style – value may outperform growth (no)
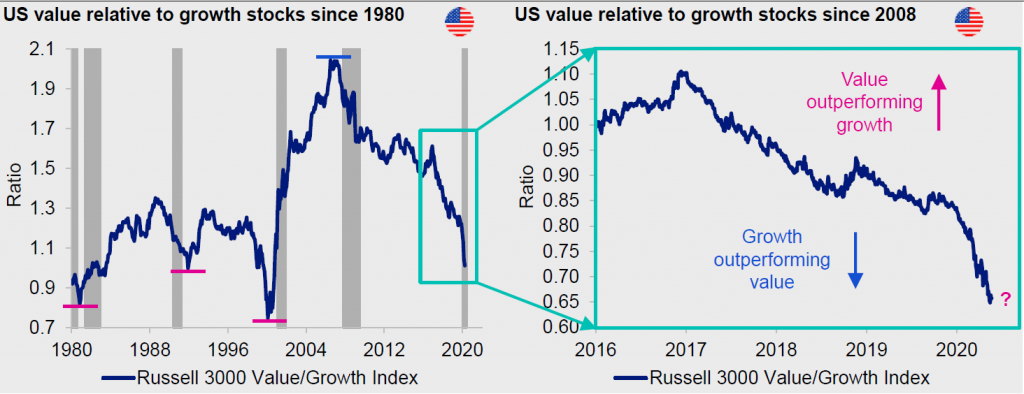
The value style of investing (which favours stocks with lower price-to-book ratios) was another leader coming out of the early-1980s, 1990s and 2000s recessions, but that wasn’t the case following the 2008-2009 recession. Why?
Compelling valuation can be a good start to an investment thesis, but value isn’t enough on its own, in my opinion. Simply put, value requires an agent for change. When economic growth becomes relatively abundant and all boats are rising with the tide, investors have the latitude necessary to pursue value strategies.
However, this cycle has generally been frustrating for value investors, owing largely to a constrained financial sector, and associated hostile and costly regulatory and legal environments.
Contrastingly, the growth style of investing (which emphasizes stocks with higher forecasted earnings growth rates) and the information technology sector have been outperforming for 13 or more years – the longest growth cycle on record. Why?
It may seem paradoxical, but growth investment strategies do better when economic growth is in short supply. In a structurally-impaired world, investors seem willing to pay up for earnings growth.
Excessive growth and tech positioning raise further questions about the next potential shift toward value and financials. Both our strategic new-cycle dashboard and tactical list of market-bottom indicators argue it may be too soon for value to outperform.
Importantly for financials, the yield curve – a market proxy for bank net interest margins – has steepened, but not enough to be consistent with past major stock market lows, in my opinion.
Figures 7 & 8. The value style of investing was another leader coming out of the early-1980s, 1990s and 2000s recessions, but that wasn’t the case following the 2008-2009 recession. This cycle has generally been frustrating for value investors, owing largely to a constrained financial sector.
Source: Bloomberg L.P., Invesco, 05/21/20. Notes: Total return indices. Shaded areas denote NBER-defined U.S. recessions. An investment cannot be made in an index. Past performance does not guarantee future results.
5. Regions – emerging markets outperform developed markets (no)
Developed market (DM) stocks represent the performance of companies based in the advanced countries of the world (e.g., the U.S., Japan, Germany, the UK, France). In the final throws of a business cycle, heading into a recession, investors flock to the perceived safety and stability of the major economies amidst slowing global growth, rising uncertainty, tightening monetary policy and a strengthening dollar. Sound familiar?
Emerging market (EM) stocks capture corporate performance in the developing countries (e.g., China, India, Brazil, South Korea, Russia). Importantly, EM stocks bottomed in the depths of the last 3 U.S. economic recessions – the final chapter of our “recovery playbook.”
In our view, the outlook for Chinese and EM stocks may be better than many investors believe because of a combination of factors: 1) China’s ironclad response to the coronavirus and a flat case count; 2) a re-opened economy and rebounding business activity; 3) cheaper valuations; 4) unprecedented Federal Reserve support and a bearish technical setup for the U.S. dollar; and 5) the relative outperformance of Chinese stocks year to date, which we believe should continue.
Figures 9 & 10. Emerging market stocks bottomed in the depths of the last 3 U.S. economic recessions – the final chapter of our “recovery playbook.” In our view, the outlook for Chinese and EM stocks may be better than many investors believe.
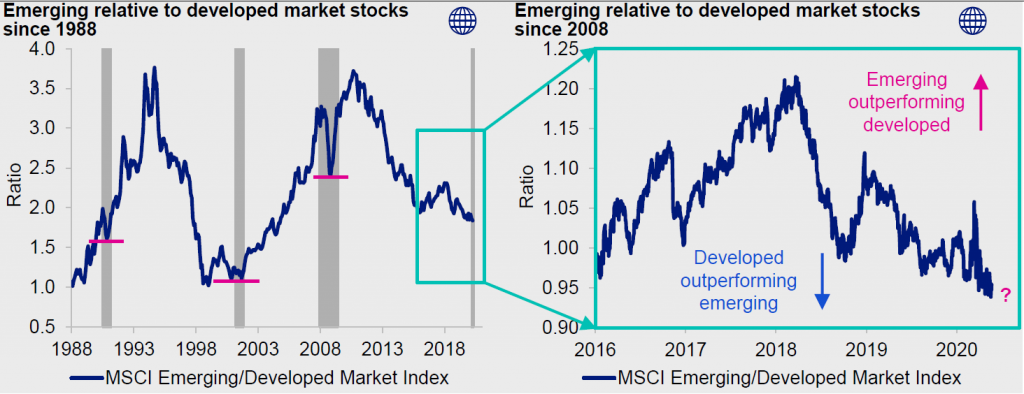
Source: Bloomberg L.P., Invesco, 05/21/20. Notes: Total return indices in U.S. dollars. Shaded areas denote NBER-defined U.S. recessions. An investment cannot be made in an index. Past performance does not guarantee future results.
All data sourced from Bloomberg L.P. as of 5/21/20 unless otherwise stated
This post was first published at the official blog of Invesco Canada.


