At turning points, the market often zigs while the economy is still zagging.
by Jurrien Timmer, Director of Global Macro, Fidelity Investments
Key takeaways
- With the S&P 500 up 27% from the March low, the market is priced for recovery, helped by a Fed that is doing whatever it takes.
- Beware of the "sell in May" talk: Past experiecnce shows that there is less than meets the eye to this strategy.
- Putting the recent market strength in perspective, history shows that the best returns for stocks often happen when earnings growth is the worst.
Time is flying by without much of an anchor these days. Work from home all day, stay at home all night. Day in day out, week in week out. At least now the weather is cooperating here in Boston with more folks out and about.
Every day I see more cars. Lots of pickup trucks, too, which suggests to me that some contractors and tradespeople are getting back to work. It makes me wonder if certain parts of the economy are coming back to life sooner than the data suggest.
Then again, it may be too soon, from a COVID perspective. If so, might we see a bump in activity now, followed by a larger, second wave of COVID-19 later? From V to W?
Let's take a look at where things stand for the year so far—and the months ahead.
2020 in review
Looking at 2020 investment returns ranked from best to worst, bonds and gold are on top, followed by large-cap growth. Small-caps and commodities are at the bottom. On the sector front, the best performers continue to be tech, health care, and utilities.
Economic outlook
We all know that the economy has imploded in recent months. But as shocking as COVID's impact on the economy has been, so has the policy response. The Fed's balance sheet is now approaching $7 trillion, up from $4.17 trillion in February.
We seem to be on course for a repeat of the 1940s, during which the US government spent massively to enter World War II, and the Fed monetized the debt that this produced. As a result, the Fed's balance sheet increased 10-fold from 1941 to 1946. By the way, the stock market rallied handsomely during that period.
The Fed may not go 10x this time around, but I can easily imagine a $10 trillion balance sheet in the coming years.
Style trends: Growth trumps value
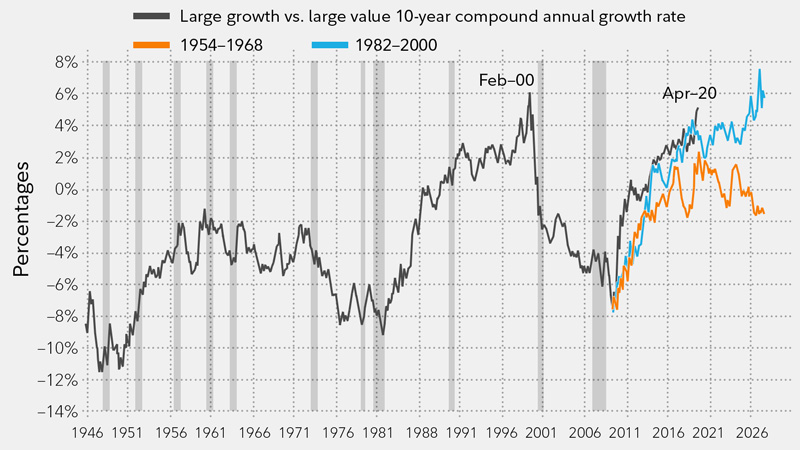
Another milestone during April was that growth stocks continued to dominate the broader market to such a degree that we are now back to the dot.com extremes of 2000. The chart below shows large growth vs. large value, overlaid against previous secular trends for growth stocks, i.e., 1982-2000 and 1951-1968. I attribute the strength to slow economic growth and an aging population looking for stable income.
Growth vs. value

Source: Haver, Factset, Ibbotson, FMRCo. Monthly data since 1871. As of April 20, 2020. Past performance is no guarantee of future results.
Sell in May?
Since it's now May, we are starting to see the usual "sell in May" warnings. Historically, stocks have been stronger in the November to May period. I looked at 5 pair trades that swap a risk asset for a safe asset at the end of May in order to take advantage of the seasonally strongest and weakest months, and then swap back in November.
- S&P 500 (SPX) vs. cash
- SPX vs investment grade bonds (Barclays Aggregate)
- SPX vs the utilities sector
- Emerging market stocks vs SPX
- Emerging market stocks vs the Barclays Aggregate
If you look at these pair trades over the last 50 years, it looks like "sell in May" could be a profitable strategy, with the more extreme the pair trades (for instance, emerging market stocks vs. bonds) potentially the more profitable. But when you look at the details, most of the excess returns were produced during the Global Financial Crisis in 2008.
If you look back 10 years instead of 50, a buy-and-hold strategy has outperformed. The SPX has produced a compound annual growth rate (CAGR) of 11.87%. That's better than all the various pair trades except the SPX/utilities.
Something to keep in mind as we start hearing more about this in May.
Bull or bear?
Are we still in a secular bull market? As I have always said, the answer is unknowable in real time. My thesis right now is that we are, but until the history books are written we just don't know. All we can do is test the actual price action against what might be expected based on previous analogs.
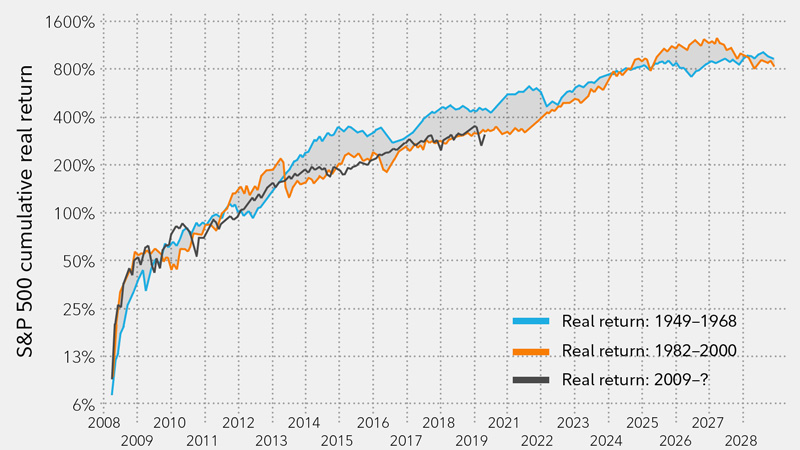
The chart below does just that. It shows the cumulative real return off the 2009 low against the 1982-2000 and 1949-1968 periods. So far, despite all the market turmoil since February, the bull market analog is holding.
Secular bull market analogs

Monthly data. Source: Haver, Factset, FMRCo. As of 5/1/2020. Past performance is no guarantee of future results.
On the other hand, the Shiller CAPE (cyclically adjusted price to earnings ratio) model suggests a more modest path forward. The CAPE model holds that the trailing 10-year P/E ratio (Shiller CAPE) has a strong inverse correlation with the next 10-year CAGR for the S&P 500. So far, the market is following the CAPE roadmap quite closely, suggesting that over the next 10 years the market will return around 8% per year. Those are not secular bull market numbers, but they're not bad either.
Falling earnings don't necessarily mean falling prices
Wall Street continues to expect a huge earnings recovery next year, with the Q2 2020 estimate calling for a 29% decline and the Q2 2021 estimate reflecting a 56% year-over-year growth rate. We'll see. Typically, the longer dated estimates are too high, and that, in my view, is especially likely this time around, given that many companies have pulled their guidance.
But remember, as terrible as earnings growth is going to be, historically there is a strong inverse correlation between extreme negative earnings growth and positive 12-month forward returns for the SPX. The market is always discounting, especially at inflection points, and this time is likely no different.
*****
About the expert

Jurrien Timmer is the director of global macro in Fidelity's Global Asset Allocation Division, specializing in global macro strategy and active asset allocation. He joined Fidelity in 1995 as a technical research analyst.
Copyright © Fidelity Investments


