


by Craig Basinger, Chris Kerlow, Derek Benedet, An Nguyen, Joey Mack, Alexander Tjiang, Richardson GMP
Summary
I. Market recap – Whipsaw
II. Investment strategy
• Fade the bounce
• Positioning
• Time to rebalance
• Behavioural coach’s corner
III. Re-evaluating Alternative Credit
IV. Emerging markets in Latin America
V. Managed portfolios
I. Market recap – Whipsaw
Derek Benedet & Joey Mack
What better way to follow March’s carnage than with equities roaring back in April, driven by unpreceded amounts of fiscal and monetary stimulus and the noticeable slowing of COVID-19. Add on talk of getting back to work and reopening the economy and it has been enough for markets to largely ignore the coming barrage of bad economic readings.
After 11 years of what many coined the most hated bull market in history, the bull ended with a fast bear drop and now the S&P 500 has rebounded 34.8% off the intra-day March lows. While we think it is still premature to say it’s the beginning of a new bull, the rebound has whipsawed investors in a way that many have never experienced. Canadian equites made a strong recovery in April with the S&P/TSX Composite up 10.8%. The S&P 500 posted an April advance of 12.8%, after losing 12.4% in March. This leaves April as just the twelfth month since WWII in which the S&P 500 climbed more than 10%.

The equity market recovery has been tremendously narrow and on declining volume. Beginning with large-cap, defensive companies initially, it took until the last week of the month for the risk-on sentiment to move into the areas of the market that were hardest hit. The Russell 2000 posted six straight gains of at least 1% to close the month as the cautious rebound morphed into a full-on buy anything rally. It is slightly concerning that both U.S. and Canadian banks have seriously lagged, with Canadian Financials barely positive on the month.
It is now apparently acceptable to buy at any price even without knowing how earnings will turn out this year. More companies continued to remove any form of forward guidance. Yes, forecast earnings estimates are laughably inaccurate, but when earnings expectations and consumer sentiment are both cratering, we can’t help but wonder how long markets could rise in this environment. Yes, markets have been buoyed by central bank actions, anti-viral drug hopes, and “Operation Warp Speed” (the Trump administration’s program to fast-track a vaccine for widespread inoculation). Realistically, vaccinations are likely well over a year away to make any serious difference in consumption and discretionary spending to get close to previous levels.
Despite the rebound in equity markets, longer-term bond yields fell in April, driven partly by falling inflation expectations due to lower oil and the fact that many of us are sitting at home. Credit spreads, however, did narrow significantly in April, reversing approximately half of the widening that occurred in March. This was driven by more unprecedented monetary policy measures, with the Bank of Canada announcing provincial and corporate bond-buying programs, supplementing the massive money market security and federal government bond-buying programs that were announced in March. Combined with the dramatic decline in benchmark bond yields over the past two months, this has pushed absolute yields on provincial and investment-grade bonds below where they were trading prior to the COVID-19 pandemic hitting North America.
Against this backdrop, the FTSE/TMX Universe Canadian bond Index posted a gain of +3.8% in April, to put the year-to-date return at +5.8%, eliminating the loss of -2.0% recorded in March. The U.S. bond market had a similar experience, with the Barclay’s Aggregate Bond Index posting a return of +1.8%, putting the year-to-date return at +5.0%. Investment grade corporate bonds outperformed in April, with the iBoxx $ Liquid Investment Grade Index up +5.6%. This puts that index in positive territory for the year at +2.2%. High yield and Emerging Markets bonds continued to lag, as although they were up +3.6% and +2.5% respectively, the iBoxx $ Liquid High Yield Index is still down -8.9% year to date, and the JPMorgan Emerging Markets Bond Index is down -11.6% for the year.
 U.S. dollar strength waned as the rally really gained its legs. The Canadian dollar appreciated by about 1% in April despite oil prices making historic lows, dipping into negative territory and Western Canadian Select oil prices temporarily trading down to around the price of a latte (at Tim Horton’s). The government also announced Tiff Macklem as the new head of the Bank of Canada, succeeding Stephen Poloz on June 3.
With declining caseloads and a coming to terms of sorts (Chart 2), we’ve likely passed the phase of “peak viral fear”. Walking back from the cliff is great for the market psyche, but realizing that you’ll have to stay uncomfortably close to the edge for a prolonged period will potentially establish a base level of fear and volatility. Add a persistent torrent of ugly economic data, impaired visibility and increasing talk of a “second-wave” and you have the recipe for open-ended potential.
II. Investment strategy
Craig Basinger & Derek Benedet
The world appears to be emerging from the COVID-19 pandemic slowly with a long way to go, but the trends appear to be in the right direction. This has a number of countries beginning to reduce or contemplate reducing the social-distancing measures that have helped limit the spread. While many uncertainties still exist, the world is in a much better mindset compared to six weeks ago when the viable path forward was not yet visible. This helped fuel the massive rebound in April, repairing roughly half the damage inflicted upon the major equity indices since this all began in late February.
It wasn’t just the improving health data that lifted markets, governments and central banks clearly demonstrated they have a ton more tools in their toolbox. Governments unleashed program after program to help bridge wages, help businesses and limit how many fall victim to the abrupt slowdown of the economy. And central banks unleashed more capital to keep markets liquid. This has helped the breakdown in credit that occurred in March, fade into the history books. It wasn’t easy though – the U.S. Federal Reserve’s balance sheet expanded by $1.1 trillion during the second half of March. That is about $1 million per second.
The crisis phase (health/market liquidity) does appear to be over. Now comes the sobering news. We are in a self-induced recession that is a real recession. The scope of this recession will be a function of the duration and level of social distancing, which is largely determined by the path of COVID-19 cases. The recovery will be a function of how economically deep this goes and the policy stopgaps designed to soften the economic blow and minimize the real economic damage. And the changing mindset of people will also factor in heavily. Make no mistake, this pandemic/recession will cause a material hit to confidence and instill a rising sense of conservatism. More savers, less spenders is great for a balance sheet but not good for an economy.
Fade the bounce
The speed and magnitude of the market sell-off in March was jaw dropping, as was the bounce in April. The bounce was not surprising, the market was very oversold, but the size of it was. Fueled by better health information and stimulus programs, few would have expected the markets to repair that much damage. However there is a problem. Markets tend to move on new information or incremental information. While the COVID-19 data may continue to improve, it is safe to say the policy response is poised to fade. We are not saying the policies are going away, more that we would have to believe the policy announcements were very front-end loaded and any May announcements will pale in comparison to those in March and April.
So as the policy “market boost” fades, the market will have to absorb economic data that will get worse and worse in the coming months. The market is already having trouble digesting earnings for Q1, which only experienced a few weeks of social distancing. Q2 earnings released in July and the economic data between now and then will continue to paint a dire picture.
We believe this market bounce will likely fade as we settle in for a bear market, which will go on for some time. Remember, bears usually last a year or longer and this one started two months ago. While there is nothing average about this bear, we don’t believe it is over. It could be a long summer.

After this big bounce off the March bottom, the markets are pricing in a lot of good news based on the expectations for the outcome of both the pandemic and the economic path forward. This is clearly pricing in a V-shaped recovery at this point. However, we have our doubts that this “glass half full” mentality will persist in the next few months as a relentless string of negative economic and earnings data weighs on the market. Our Market Cycle Framework, which has now moved to just 7 positive signals (it had 22 positive signals at the start of March), has entered what we would consider a highly cautionary or “danger zone,” indicating the potential for a sustained downturn. Moreover, we believe that incrementally shifting away from riskier assets to move to more defensive ones is appropriate at this time, taking advantage of the recent rally.
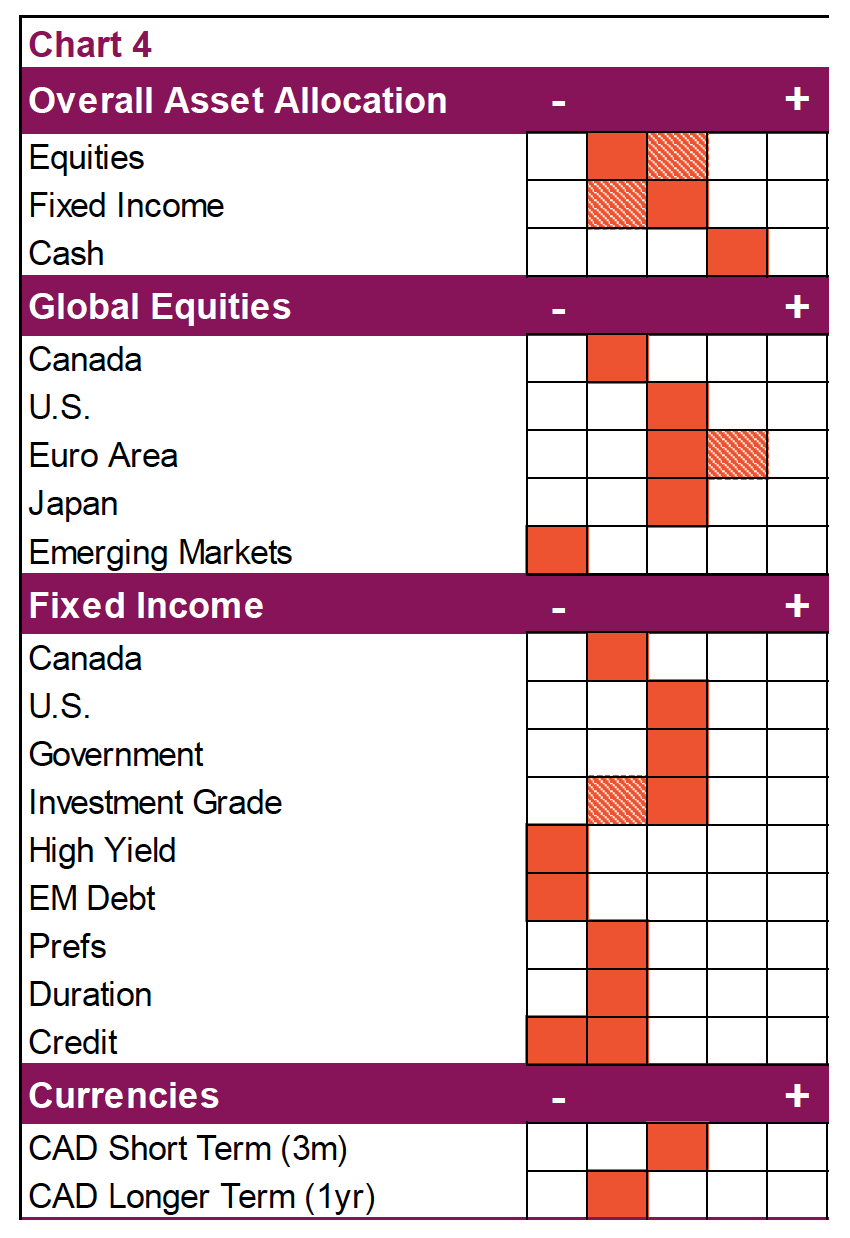 The portfolio positioning changes we have made reduced equity and added to fixed income. We reduced an overweight in international equity as well as further increased our Canadian underweight. Europe is more dependent on foreign trade, which will likely trail the recovery. With big questions regarding the future of the energy sector and highly indebted households, Canada may feel more relative pain of this recession compared to our neighbors. We have maintained our neutral weight in U.S. equities in part due to the relative magnitude of the policy response.
We are increasing our recommended fixed income exposure, specifically a move into Canadian corporate credit as we believe it retains some relative value. The repricing of risk in the corporate bond market has tilted the medium-to-long-term risk/reward profile back in favour of investors, making it a more attractive place to be. Typically, the credit market will have less downside compared to the equity markets, thereby offering an attractive risk/reward profile. Underlying liquidity concerns have abated thanks to central bank intervention. The renewed asset purchases by central banks and the prospect of a stable rates backdrop support the sector at a time when valuations reached levels that are historically attractive.
Time to rebalance: Options for investors & advisors
The market drop and bounce off the bottom has created an opportunity for asset allocators based on several different perspectives. While we acknowledge the path forward remains uncertain and likely volatile, there are numerous ways to be proactive:
• Rebalance your asset allocation. Even if you do not deploy a tactical approach to asset allocation and adhere to a long-term static allocation based on investor objectives, big market moves can push the allocation off its desired mix. It is likely the equity component has shrunk relative to other asset classes. Recalibrating the portfolio will effectively have you buying the more depressed asset class and trimming the winning asset classes. It also helps control risk (chart 5).

• Tax-loss harvesting. Given the bear market, there is a possibility you may own some things that have declined in value. There are strategies that can help harvest and lock in these losses. Please speak with your advisor or tax consultant.
• Assess your risk. This bear is certainly a challenging one for portfolio managers. However, it has also revealed many strategies that were believed to be defensive that simply were not. If you own too many of those, take advantage of this market bounce to better adjust your portfolio.
Behavioural coach’s corner
The COVID-19 pandemic is truly traumatic with both human costs and a blindside sucker punch to the economy. Economic data is set to be in the dumps for months, while earnings will be awful. Worse yet, it is all very vivid: Images from Italy and NYC of health facilities pushed beyond capacity, streets that are near empty, store fronts boarded up are among the pictures etched into our minds. Add to this the daily consumption of more media than normal. Unusual and really negative events leave a strong imprint on our minds and can lead us to over extrapolate.
This environment has kicked the Availability Bias into high gear. This bias is our tendency to focus or think of examples that are more vivid and believe they are more representative. The media contributes to this, as focusing on more extreme images or data points is often more entertaining than boring statistics.
Along these lines, how much should investors react to poor company earnings in Q2 and Q3? We believe the vast majority of companies will survive this and resume thriving a few quarters down the road. Remember, a company is worth its long-term cash flow-generating ability. In the heat of the moment when looking at a really bad quarterly earnings result, investors can lose sight of this.
Sometimes we get so caught up in what is happening now, we lose sight of the longer view. We may not know when, but we will be eating at restaurants again, watching our favourite home team in person and generally able to move about as we choose. It may be harder than ever, but thinking long term is crucial in navigating bear markets.
III. Re-evaluating alternative credit
Romain Marguet
From 2009 and the great financial crisis, the credit space was heavily reshaped by many new entrants who were bucketed as “alternative” credit managers. Many managers in the public credit space, like Long/Short credit managers and alternative lenders, enjoyed newfound popularity in a yield-starved environment where they were essentially able to generate greater yields by using a variety of strategies and levers not available to conventional bond managers. But we’ve now had a stress test due to COVID-19. Most of the alternative credit strategies available today did not emerge until after 2009 and this is their first major crisis. We are definitely not through this crisis and we do not believe any manager should be evaluated on their performance over one month or even a single quarter. So we will have to wait and see how each alternative manager performs through this period before we can draw meaningful conclusions, but the sudden shock to the markets has most definitely highlighted key risks that may have been overlooked during the bull market. This shock to credit markets has also changed the credit landscape and that means this is a good time to also re- evaluate the construction of many portfolios.
There are several key points in alternative credit/income worth highlighting as we move forward and beyond this crisis:
• The more complex the product, the more work has to be done to understand its risks. Read and understand offering memorandum (OM) structures, what the manager is allowed to do and prevented from doing, how they monitor risk, what happens to the asset class they trade when markets go sideways, how liquid or illiquid can they become, do they have too much potential for style drift or will they likely gate (i.e. bar withdrawals from their funds) due to weak liquidity provisions.
• Most investment grade (IG) Long/Short credit managers had an uncharacteristically bad month in March. They had not properly identified liquidity and ETF-driven redemption flow effects on IG credit markets. But now their portfolio yields are elevated between 7%-12% from the same IG credit portfolios that yielded roughly 4% a few months ago. OK, perhaps after the April rebound the yields may not be that high anymore. Still, is this a good time to increase exposure to such strategies for clients that understand the potential volatility profile of these funds during rare, heavy stress periods, like this crisis? How do you position this type of strategy within your bond portfolio and understand the potential future downside risks versus the current attractive risk/return profile of their strategies?
• Many alternative lenders have gated due to liquidity mismatches between their underlying loan book and the liquidity they allow to investors. This was completely unavoidable and will continue to happen to other lenders in this asset class the longer this crisis continues. This does not necessarily mean they have lost any money nor that they have any issues with their loan book. It does highlight that all investors in these strategies need to understand that these are inherently illiquid strategies with illiquid underlying assets, especially in stress periods. All investors need to understand that the actual underlying liquidity for investors is only as good as their longest dated loan – often 1.5 to 3+ years, and not monthly or quarterly. Going forward, as is the case with their U.S. and global counterparts, these funds should be marketed to investors as such. Private credit now has a core and permanent place in all institutional portfolios, and many HNW investors will also benefit from its use on a go-forward basis. However, it is important in this new credit landscape to evaluate how much of the portfolio needs to be dedicated to these illiquid strategies versus other more liquid public alternative credit strategies.
• Private real estate income-generating strategies are another asset class that saw some funds gate. This was due to the same liquidity mismatch issues as the lenders. The same principles for evaluating actual liquidity, and restructuring future liquidity expectations within this space should apply. Many of these strategies can provide excellent uncorrelated diversification based on their various profiles and geographies. Due to the complexities in the structure of these strategies and the layers of fees, it’s important to look past the marketing and understand how money flows in each strategy and where fees are charged. It’s also important to understand how various strategies complement each other and how they will fare on a go-forward basis. (The multi-residential sector, for instance, will not perform the same way as industrial logistics or retail or single family). Most clients can benefit greatly from exposure to various private real estate strategies, but evaluating the liquidity, competitive advantage of each team and pitfalls of each individual strategy is key.
As with any strategy, either public or private, it is crucial to understand how it is likely to perform within different market environments. Equally important is how it fits into the overall portfolio. Often, what an investment sits next to within a portfolio is as important as the investment itself. In this low-yield world, some portfolios moved too much into alternative credit as a source of yield. Bear markets and credit weakness has quickly revealed portfolios that have too much of certain things. The alternatives available today have an extremely diverse strategy spectrum including income, volatility management and growth. Diversification remains key.
IV. Emerging markets
Chris Kerlow
The calamity of the sell-off and subsequent rally in North American markets has been incredible. Turning our attention to international markets meant trying to utilize the three-week crash course in epidemiology to determine if foreign nations had reached an inflection point in their active cases or if the worst was still to come.
Most of Asia and parts of Europe have seen the worst, at least of this wave, and are well underway to getting back up to speed. We might be starting to see the other side of the curve in parts of North America and local governments are beginning to roll out steps to restart the economy. Parts of Latin America (LatAm) are one step ahead of us on the restart; states in Brazil, for example, have dialled back restrictions on gyms, malls and churches and some retail is beginning to reopen. But far behind us on the COVID-19 curve, Brazil added this past week more active cases than any country besides the U.S. and U.K. Unfortunately, in most Latin American countries, active cases and death tolls continue to rise, but that is not slowing restart efforts.
LatAm does not have the ability to take the same approach we saw in Asia and North America. Authoritarian countries in South East Asia were able to control human flow with strict enforcement. Developed regions like Canada and the U.S. could “drop money” into people’s bank accounts rewarding them for staying home. Brazil, Mexico and most regions in the area have much higher levels of poverty, homelessness, lower living standards and a much larger component of grey market businesses. This makes it much harder for governments to force economic shutdowns, enforce social distancing and effectively use central bank intervention to help mitigate the economic impact of the virus.
Sao Paulo, the epicenter of the disease in Brazil, has seen social isolation fall to below 50% in recent days, below the 70% required to control the spread of the disease, according to local officials. Parts of the country are already seeing the health system stretched and further intensification could greatly stress the system.
Central banks in the region have taken action with Mexico opening a 25 billion Peso lending facility for small and medium sized businesses. Brazil has lowered the policy rate to a record low of 3.75 and reduced reserve requirements. These efforts are admirable but pale in comparison to other regions. Bloomberg ranks Latin American governments as the least effective among the 20 developed and emerging countries listed. They also are the least trusted; however, it is worth noting China did not register a reading for that criteria (Chart 6).

The severity of the health situation aside, North American investors watched the fastest bear market of all time be followed by one of the most ferocious market rallies, all in the face of worsening virus conditions. Now, many suffering from FOMO (fear of missing out) wonder if EM equities are a coiled spring ready to bounce back.

Globalization and the country-by-country infection path this disease followed has us focusing this week exclusively on Latin American markets and the opportunities or threats in that region.
The biggest players are Brazil and Mexico, accounting for 60% and 22% of the MSCI LatAm index. This is down 37% over the past three months in U.S. dollar terms (34% in CAD); but in Brazilian reals it is down 20%, roughly in line with that of the Russell 2000 (Chart 7). The LatAm index does not possess any of the mega-cap technology leaders that have been driving the outperformance of U.S. large-cap equities. The biggest drag on LatAm investments has been related to currency weakness as this risk-off environment sends their currencies lower compared to safe havens like the USD.
The relative strength of most LatAm currencies has been declining for the last half of the decade as the U.S. has increasingly gained more energy independence, reducing their need to import petrochemicals from other parts of the world. But since the start of the year, we have seen Latin American currencies decimated.

South America’s GDP has been particularly hard hit by the virus. A large part of these economies is in the informal grey market, making them harder for governments to support and revive on the other side of this pandemic. They also rely heavily on tourism, which has been completely halted and likely to see a slow ramp up and many years to return to previous levels.
On top of that, add the fact that most of the countries in the region are running a current account deficit (Chart 8), meaning they import more than they export or sell abroad. When you have to pay for goods priced in US dollars with a declining local currency value, you are importing inflation and reducing the margin of value chain transactions.
This backdrop has caused rating downgrades of government debt for major economies in the region. Brazil, Mexico, Bolivia and others have all received rating downgrades or downward revisions in outlooks over the last few weeks, all of which were at or near high-yield ratings to begin with.
Portfolio Implications. Although the entry point might appear attractive, these areas are going to struggle to bounce back and the outlook for an extended U-shaped recovery is much higher than in North America. However, every investment is attractive at the right price. If we see a second wave of broad-based equity market weakness, which undermines currencies and stock markets to extreme levels, it would be worth revisiting the opportunity. The time for EM will happen, but we think it is still too early.
V. Managed portfolios – The implementation of our investor strategy
An Nguyen
Managed Portfolios are the quintessential rubber hitting the road, taking our team’s investor strategy to the implementation stage. These portfolios capture our recommended asset tilts, geographic allocations, bond allocations from credit to duration, style and risk exposure, all using F-class funds and ETFs. Managed Portfolios also capture our changing views and tactical adjustments. In the Investment Strategy section, we recommended trimming equity exposure to take advantage of this bounce in the markets that we believe will prove fleeting. In Managed Portfolios (Balanced) we:

• Reduced iShares Core MSCI EAFE ETF (IEFA in US)
• Reduced iShares Core S&P/TSX Composite ETF (XIC on T)
• Bought (new position) Lysander Corporate Value Bond
This effectively reduced equity from a minor underweight to a more substantial underweight, and raised both the bond allocation and cash levels, keeping some dry powder should we see better opportunities in the coming months.
A resilient approach to investment management
Our Managed Portfolios offering was developed using an institutional framework that balances longer-term investment objectives with shorter-term investment opportunities. Each portfolio invests in a diversified set of funds and ETFs that are unique yet complementary to one another.
In order to understand the portfolio exposures and subsequent levers to performance, Managed Portfolios is compartmentalized into two main strategies “Core” and “Plus”. The Core strategy typically makes up approximately 75% of the portfolio, while the Plus component makes up the remaining 25%. Each strategy is further broken down into “buckets”. The Core strategy is composed of the Income and Growth buckets. These buckets are largely static in their underlying allocation and invest in a mix of income and growth funds. The Plus strategy is composed of the following: real assets, volatility management and opportunistic buckets. The allocations of these buckets are relatively dynamic and may invest in a wide array of investments that will shift based on our assessment of the market’s outlook.
Each bucket in the portfolio was constructed to have the following:
• Largely public, highly liquid investments
• Mix of active and passive investments
• Unique investment objective
• Lower correlation relative to other buckets
• Share similar risk-reward characteristics

Charts are sourced to Bloomberg L.P. & Richardson GMP unless otherwise noted
Source: All charts are sourced to Bloomberg L.P. and Richardson GMP unless otherwise stated.
The opinions expressed in this report are the opinions of the author and readers should not assume they reflect the opinions or recommendations of Richardson GMP Limited or its affiliates. Assumptions, opinions and estimates constitute the author's judgment as of the date of this material and are subject to change without notice. We do not warrant the completeness or accuracy of this material, and it should not be relied upon as such. Before acting on any recommendation, you should consider whether it is suitable for your particular circumstances and, if necessary, seek professional advice. Past performance is not indicative of future results. The comments contained herein are general in nature and are not intended to be, nor should be construed to be, legal or tax advice to any particular individual. Accordingly, individuals should consult their own legal or tax advisors for advice with respect to the tax consequences to them, having regard to their own particular circumstances. Insurance services are offered through Richardson GMP Insurance Services Limited in BC, AB, SK, MB, NWT, ON, QC, NB, NS, NL and PEI. Additional administrative support and policy management are provided by PPI Partners. Insurance products are not covered by the Canadian Investor Protection Fund.
Richardson GMP Limited, Member Canadian Investor Protection Fund. Richardson and GMP are registered trademarks of their respective owners used under license by Richardson GMP Limited.
©Copyright May 4, 2020. All rights reserved.