Chief Economist Scott Brown discusses current economic conditions.
We’re still missing a lot of information on the fourth quarter, but recent reports paint a picture of moderate growth in the overall economy. That picture will become clearer as December data arrive next month. The economy was mixed in 2019, and should remain mixed into the first half of the year.
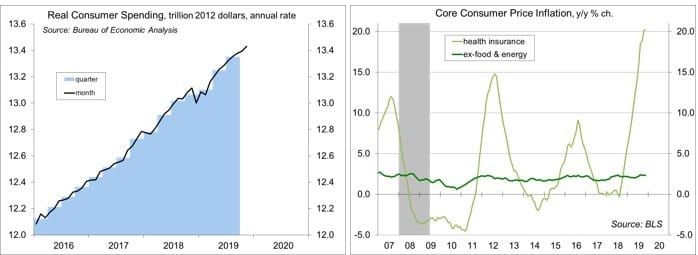
Consumer spending accounts for 68% of Gross Domestic Product. Figures through November suggest about a 2.2% annual rate in spending growth for 4Q19. We’re missing December data and previous figures are subject to revision, so that estimate will change. However, it’s consistent with the underlying trend over the last year. Recall that spending growth in 4Q18 and 1Q19 were unusually soft. The government shutdown last year was a significant drag. Strength in 2Q19 and 3Q19 was about getting back on track.
Spending has been supported by job gains and wage growth. However, growth in average hourly earnings has recently suggested a shift. Production workers are seeing stronger gains, while others are seeing smaller gains. Those at the bottom of the income scale have seen significant improvement, largely due to increases in state and local minimum wages (the federal minimum wage is $7.25, unchanged since July 2009). The top 1% are doing well. The middle class continues to struggle amid higher health care costs (the health insurance component of the CPI rose 20.2% over the 12 months ending November), higher education costs, and a lack of affordable housing. While much of the debate on income inequality has focused on the top 1% and taxes, the whittling away of the middle class is a bigger concern for the long-term prospects of the U.S. economy. The economic prospects of middle class independent voters will be key in the November election.
Ex-food and energy, the PCE Price Index, the Fed’s preferred inflation gauge, rose 1.6% over the year ending November, still below the Fed’s 2% goal. The Fed fears that a prolonged trend below 2% will push inflation expectations lower, making it harder for the Fed to hit its target. Hence, monetary policy is likely to remain accommodative. The Fed is uncertain about the amount of slack remaining in the job market, but sees generally little flow-through from higher wages to higher consumer price inflation.
Business fixed investment was weak in 2019. A decrease in energy exploration (which is capital intensive) and problems at Boeing had an impact. Mining structures (which includes oil and gas well drilling) fell 15.0% over the year ending 3Q19 (vs. 60.7% in the 2015-16 energy correction). Boeing’s problems will continue. The halt in production of the 737 Max may subtract 0.5 percentage point from GDP growth. Trade policy uncertainty and slower global growth also kept business investment back on its heels in 2019. The trade truce with China is a positive development, but does not eliminate uncertainty. The global economy should pick up somewhat, with the Fed’s rate cuts helping emerging economies.
Recession fears have decreased, although they haven’t gone away. The fear was that the factors dampening business fixed investment would lead to reduced hiring and layoffs, but there’s not much evidence of that. A steeper yield curve helps, but higher mortgage rates will hurt the housing sector. The economy will be sensitive to any negative shocks that may occur – and we can be certain that there will be some surprises in 2020.
Data Recap – Stock market participants remained optimistic, despite impeachment. The economic data were not particularly market-moving, but remained consistent with moderate growth in the overall economy.
The House of Representatives approved two articles of impeachment against President Trump. It's widely expected that Trump will be acquitted in the Senate, although it's unclear when the trial will take place.
Real GDP rose at a 2.1% annual rate in the 3rd estimate for 3Q19 (vs. +2.1% in the 2nd estimate and +1.9% in the advance estimate).
Personal Income rose 0.5% in November (+4.9% y/y), boosted partly by farm subsidies. Private-sector wages and salaries rose 0.4% (+5.3% y/ y). Personal Spending rose 0.4% (+3.9% y/y), up 0.3% (+2.4% y/y) adjusting for inflation. The PCE Price Index rose 0.2% (+1.5% y/y), up 0.1% (+1.6% y/y) excluding food & energy.
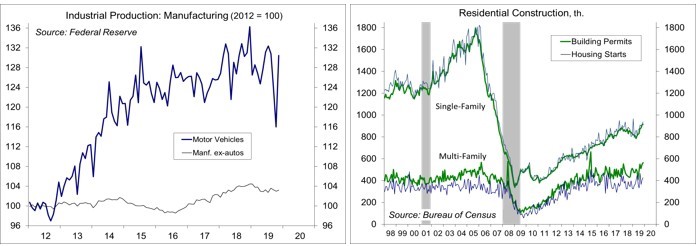
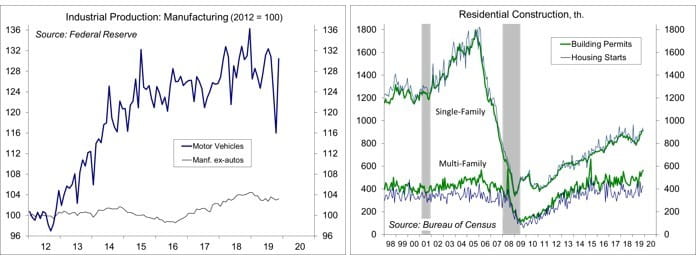
Industrial Production rose 1.1% in November, following declines of 0.4% in September and 0.9% in October. The increase reflected a rebound from the effects of the GM strike. Motor vehicle production rose 12.4% (-0.4% y/y). Ex-autos, manufacturing output rose 0.3% (-0.9% y/y). Results were mixed, but mostly positive across industries. Oil and gas well drilling fell 3.9% (-23.4% y/y), while energy extraction rose 0.4% (+7.6% y/y).
Building Permits rose 1.4% (±1.4%) in November, to a 1.482 million seasonally adjusted annual rate (+11.1% ±1.8% y/y). Single-family permits, the key figure in the report, rose 0.8% (+8.9% y/y). Housing Starts rose 3.2% (±13.6%), to a 1.365 million pace (+13.6% ±12.8% y/y).
Existing Home Sales slipped 1.7%, to a 5.35 million seasonally adjusted annual rate in November (+2.7% y/y). Results were mixed across the four regions. Unadjusted sales for September-November were up 3.4% from the same period in 2018 (Northwest 0.0%, Midwest +1.3%, South +5.2%, West +4.6%). The National Association of Realtors continued to note strong demand for housing, but with ongoing supply and affordability issues.
Homebuilder Sentiment jumped 5 points to 76 in December. The increase was led by improvement in current sales conditions. Results were mixed across regions (Northeast -6, Midwest +15, South +2, West -2). While the December figure was likely exaggerated, builder perceptions have improved. However, “we are still underbuilding due to supply-side constraints like labor and land availability," according to the National Association of Home Builders.
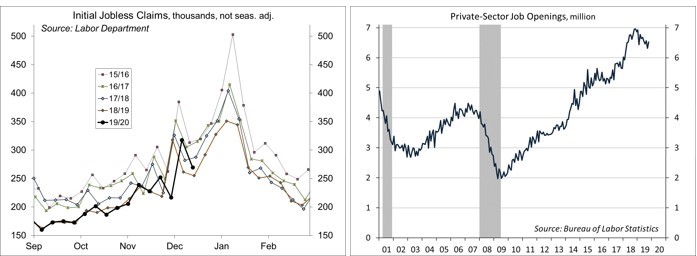
Jobless Claims fell to 234,000 in the week ending December 14, vs. 252,000 in the prior week and 203,000 for the week before that (figures are volatile during this time of year). At 225,500, the four-week average remained low by historical standards.
The Job Opening and Labor Turnover Survey showed an uptick in job offerings in October, but not enough to offset the general downtrend over the previous 12 months. Hiring and quit rates have been roughly steady in recent months.
The Index of Leading Economic Indicators was unchanged in November, following three consecutive monthly declines of 0.2% each. Positive contributions were led by the stock market and credit. Negative contributions were led by ISM New Orders. A 0.4% increase in the Index of Coincident Economic Indicators was led by the increase in nonfarm payrolls and the GM-related rebound in industrial production (the other two of its components are estimated).
The UM Consumer Sentiment Index rose to 99.3 in the full-month assessment for December, vs. 99.2 at mid-month and 96.8 in November. “Most of the gain was among upper income households,” according to the report.
The Bank of England left short-term interest rates unchanged.
The opinions offered by Dr. Brown should be considered a part of your overall decision-making process. For more information about this report – to discuss how this outlook may affect your personal situation and/or to learn how this insight may be incorporated into your investment strategy – please contact your financial advisor or use the convenient Office Locator to find our office(s) nearest you today.
All expressions of opinion reflect the judgment of the Research Department of Raymond James & Associates (RJA) at this date and are subject to change. Information has been obtained from sources considered reliable, but we do not guarantee that the foregoing report is accurate or complete. Other departments of RJA may have information which is not available to the Research Department about companies mentioned in this report. RJA or its affiliates may execute transactions in the securities mentioned in this report which may not be consistent with the report's conclusions. RJA may perform investment banking or other services for, or solicit investment banking business from, any company mentioned in this report. For institutional clients of the European Economic Area (EEA): This document (and any attachments or exhibits hereto) is intended only for EEA Institutional Clients or others to whom it may lawfully be submitted. There is no assurance that any of the trends mentioned will continue in the future. Past performance is not indicative of future results.


