by Scott Brown, Ph. D., Chief Economist, Raymond James
Chief Economist Scott Brown discusses current economic conditions.
Fed Vice Chair Richard Clarida spoke on Friday and briefly summarized the outlook for the economy and monetary policy. “The U.S. economy is in a good place, and the baseline outlook is favorable,” Clarida said. However, “despite this favorable baseline outlook, the U.S. economy confronts some evident risks in this the 11th year of economic expansion.” Monetary policy “is not on a preset course, and the Federal Open Market Committee will proceed on a meeting-by-meeting basis to assess the economic outlook as well as the risks to the outlook, and it will act as appropriate to sustain growth, a strong labor market, and a return of inflation to our symmetric 2 percent objective.” While Clarida failed to provide a clear clue on whether the Fed will cut short-term interest rates again on October 30, he indirectly illustrated the Fed’s internal debate.
As we saw in the Summary of Economic Projections released in September, the Fed’s economic outlook is similar to most outside economists. The baseline scenario is for moderate growth in 2020, with growth in real GDP near 2%, and inflation moving gradually toward the Fed’s 2% goal. The unemployment rate, currently at 3.5%, is at a 50-year low. The most recent Beige Book noted that “labor market tightness across skill levels and occupations was widely cited as a factor restraining hiring.” Wages are rising broadly in line with productivity growth and underlying inflation, and despite ongoing tightness in labor market conditions, there is no evidence that wage pressures have fueled a substantial increase in consumer price inflation. Laissez les bon temps rouler!
Clarida noted that “business fixed investment has slowed notably since last year, exports are contracting on a year-over-year basis, and indicators of manufacturing activity are weakening.” In its latest World Economic Outlook, the IMF marked down its forecasts of global growth and cautioned that “with the slowdown in industrial production, trade growth has come to a near standstill.” Despite wage pressures and the impact of tariffs, firms have had a mixed ability to pass higher costs along. “Global disinflationary pressures cloud the outlook for U.S. inflation,” according to Clarida.
Recall that Chair Powell cited three reasons for cutting rates in late July and mid-September: “It is intended to insure against downside risks from weak global growth and trade policy uncertainty, to help offset the effects these factors are currently having on the economy, and to promote a faster return of inflation to our symmetric 2% objective.” The global outlook has weakened further, trade policy remains uncertain, and while the Fed remains optimistic about inflation moving toward the 2% goal, it’s been consistently wrong about that. Hence, while the outlook remains favorable, the risks are weighted to the downside.
The Fed usually arrives at its policy decisions by forming a consensus. However, Fed officials have been divided on the appropriate course of monetary policy. This was seen in the dot plot, which shows senior Fed officials’ projections of the appropriate year-end level of the federal funds rate. The June dot plot showed a nearly even split between those expecting no change in rates this year and those anticipating a total cut of 50- basis points. In the revised dot plot in September, five of 17 officials did not want a rate cut, five expected no further cuts (beyond the September cut), and seven expected one more 25-bp rate cut. The minutes of the September 17-18 FOMC meeting confirmed the split among Fed officials. Not all of the senior fed officials vote on policy, and the balance of power appears to be weighted toward the doves. While monetary policy is a committee decision, the FOMC is dominated by the Fed’s Board of Governors, and the chair should lead the governors.
It’s important to note that the 2020 GDP growth baseline forecast of 2% is now about as good as it gets. Gross Domestic Product (a measure of output) can be viewed as the amount of labor put into the economy times the output per worker (or productivity). Hence, GDP growth is the growth in the labor input plus the growth in productivity. A 0.5% trend in the labor force plus productivity growth of 1.0-1.5% gets you GDP growth of 1.5-2.0%. Granted, there may be more slack in the job market and productivity growth could pick up, but neither of these is likely. Productivity growth is related to business investment, which has been soft (a subdued pace of business investment is viewed as the key factor in slower global productivity growth over the last decade).
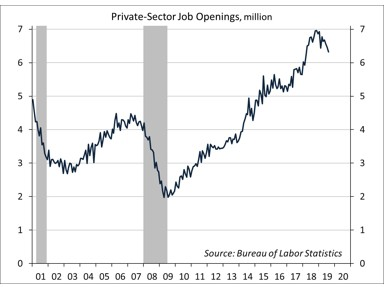
While the upside risks to the growth outlook appear limited, the downside risks are more significant. We don’t see signs of significant imbalances, the kind the led up to previous recessions. However, the soft global economy and trade policy uncertainty have weighed against business fixed investment. Consumer spending growth has been uneven over the last year (weak in 4Q18 and 1Q19, strong in 2Q19), but generally strong. Yet, September retail sales figures pointed to a loss of momentum closing out 3Q19. While business investment has weakened, labor demand has not rolled over. There are some signs of a possible shift. Weekly claims for unemployment benefits remain low, but job openings have fallen since late 2018 (still very high though). Corporate layoff announcements, while generally low, have trended higher this year. Job growth has slowed, but part of that appears to reflect a lack of skilled labor. Investors should focus on the broad range of labor market indicators in the months ahead.
Data Recap – The economic data were generally on the soft side of expectations. U.S./China trade progress appeared to be one-sided after Chinese officials indicated that a deal was not close at hand). Stock market investors were encouraged by prospects for a Brexit deal, which was headed for a Saturday vote in Parliament.
In its World Economic Outlook, the IMF further downgraded its outlook for global growth. The IMF noted that “global growth has fallen sharply over the past year.” The weakening “has been broad-based among advanced economies, affecting major economies (the United States and especially the euro area) and smaller Asian advanced economies.” Trade growth “has come to a near standstill.” Still, “while manufacturing lost steam, services (a larger share of the economy) broadly held firm.”
The Fed’s Beige Book noted that “the U.S. economy expanded at a slight to modest pace” into early October. Manufacturing activity “continued to edge lower,” while contacts in some Fed districts indicated that “persistent trade tensions and slower global growth weighed on activity.” Businesses generally expect slower growth (but still positive). “Labor market tightness across skill levels and occupations” was widely cited as “a factor restraining hiring.” Wage pressures remained generally moderate, and firms continued to use non-wage sweeteners to attract and retain workers. Higher input costs are squeezing manufacturers, but retailers had more success in passing higher costs along. Price increases were described as “modest.”
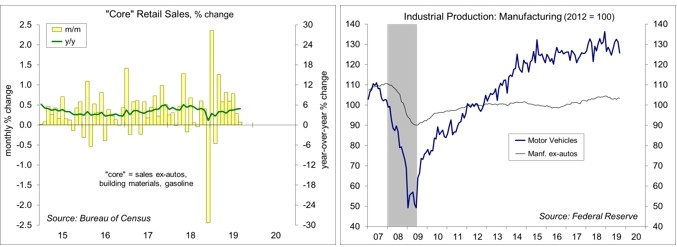
Retail Sales fell 0.3% in September (+4.1% y/y), down 0.1% ex-autos (+3.7% y/y). Motor vehicle sales fell 0.9% (+5.6%), following a 1.9% jump in August. Sales of building materials fell 1.0% (+0.7% y/y), following a 2.3% surge in August. Sales of gasoline fell 0.7% (-2.7% y/y), reflecting lower prices (gasoline prices fell 2.4% in the September CPI report). Core sales, which exclude autos, building materials, and gasoline, edged up 0.1% (+4.9% y/y) with mixed revisions to July and August. Department store sales fell 1.4% (-6.1% y/y), while non-store retail sales (including internet shopping) slipped 0.3% (+12.9% y/y). Sales at restaurants and bars rose 0.2% (+4.9% y/y). The report suggests some loss of momentum in consumer spending growth ending the quarter.
Industrial Production fell 0.4% in the initial estimate for September (-0.1% y/y), reflecting the strike at General Motors. Motor vehicle production fell 4.2% (-5.4% y/y). The output of utilities rose 1.4% (+1.2% y/y). Mining output fell 1.3% (+2.6% y/y) – oil and gas well drilling fell 5.5% (-13.9% y/y), while energy extraction slipped 0.5% (+6.7% y/y). Manufacturing output fell 0.5% (-0.8% y/y), down 0.2% excluding motor vehicles (-0.5% y/ y). Results were mixed across industries.
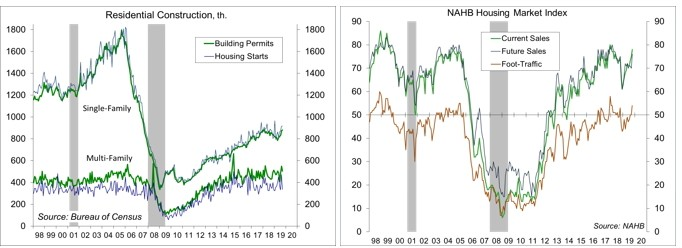
Building Permits fell 2.7% (±1.3%) in September, to a 1.387 million seasonally adjusted annual rate (+7.7% y/y). Single-family permits rose 0.8% (+2.8% y/y), while the more volatile multi-family permits fell 8.2% (+17.4% y/y). Unadjusted single-family permits for the third quarter were up 2.8% from 3Q18, mixed across regions (+0.7% in the Northeast, -0.3% in the Midwest, +4.9% in the South, and +0.6% in the West). Housing Starts fell 9.4% (±9.4%) to a 1.256 million pace (+1.6% y/y), with single-family starts up 0.3% (±9.3%, +4.3% y/y).
Homebuilder Sentiment rose to 71 in October, vs. 68 in September – the highest since early 2018 (when residential fixed investment began a six quarter downtrend). Results were mixed across regions, with strong gains in the South and West.
Business Inventories were unchanged in August (+4.2% y/y), while business sales (factory shipments plus wholesale and retail sales) rose 0.2% (+1.1% y/y). Retail inventories, the only new information in the report, fell 0.1% (autos -0.1%, ex-autos -0.2%). Manufacturing inventories (reported
earlier) were flat and wholesale inventories rose 0.2%. These figures are not adjusted for price changes. Through the first two months of 3Q19, the pace of inventory growth appears slower than in 2Q18, but part of that is lower petroleum prices.
The Index of Leading Economic Indicators fell 0.1% in the initial estimate for September, following a 0.2% decline in August (revised from 0.0%), consistent with a slower pace of growth in the near term and an increased chance of a recession in 2020.
The opinions offered by Dr. Brown should be considered a part of your overall decision-making process. For more information about this report – to discuss how this outlook may affect your personal situation and/or to learn how this insight may be incorporated into your investment strategy – please contact your financial advisor or use the convenient Office Locator to find our office(s) nearest you today.
All expressions of opinion reflect the judgment of the Research Department of Raymond James & Associates (RJA) at this date and are subject to change. Information has been obtained from sources considered reliable, but we do not guarantee that the foregoing report is accurate or complete. Other departments of RJA may have information which is not available to the Research Department about companies mentioned in this report. RJA or its affiliates may execute transactions in the securities mentioned in this report which may not be consistent with the report's conclusions. RJA may perform investment banking or other services for, or solicit investment banking business from, any company mentioned in this report. For institutional clients of the European Economic Area (EEA): This document (and any attachments or exhibits hereto) is intended only for EEA Institutional Clients or others to whom it may lawfully be submitted. There is no assurance that any of the trends mentioned will continue in the future. Past performance is not indicative of future results.
Copyright © Raymond James


