Equity markets have started to creep back upward this week as investor confidence has started to improve. There hasn’t been much in the way of hard news but positive signals related to US-China trade talks scheduled for next month and UK lawmakers pushing back against a no-deal Brexit suggest that some of the fears from earlier this summer relating to trade wars causing a global recession are starting to appear overblown.
In the coming week we may get a better indication of whether investors should be confident of fearful from major central banks. The ECB meets Thursday and the Fed meets next week. Both central banks are walking a fine line between staying the course and talking positively about their economies (which could spark accusations of not doing enough and ignoring the risks out there) and providing too much support (which could cause investors to think the risks are worse than they are and cause a panic). For the US, the Fed also needs to consider that their independence in the face of mounting political pressure to make deep cuts. In recent days, US treasury yields have been creeping back upward, suggesting that investors are backing away from expectations of more than a quarter-point cut.
In this week’s issue of Equity Leaders’ Weekly, we take a look at renewed interest in technology stocks through the NASDAQ 100 Index, and at some of the factors driving recent swings in energy prices.
NASDAQ 100 Index (NASD.I)
With its higher weighting in growth sectors like Technology, Communications Services (Internet) and Biotechnology, action in the NASDAQ 100 can be seen as a barometer of how aggressive or defensive investors are at a point in time and how their appetite for risk changes over time.
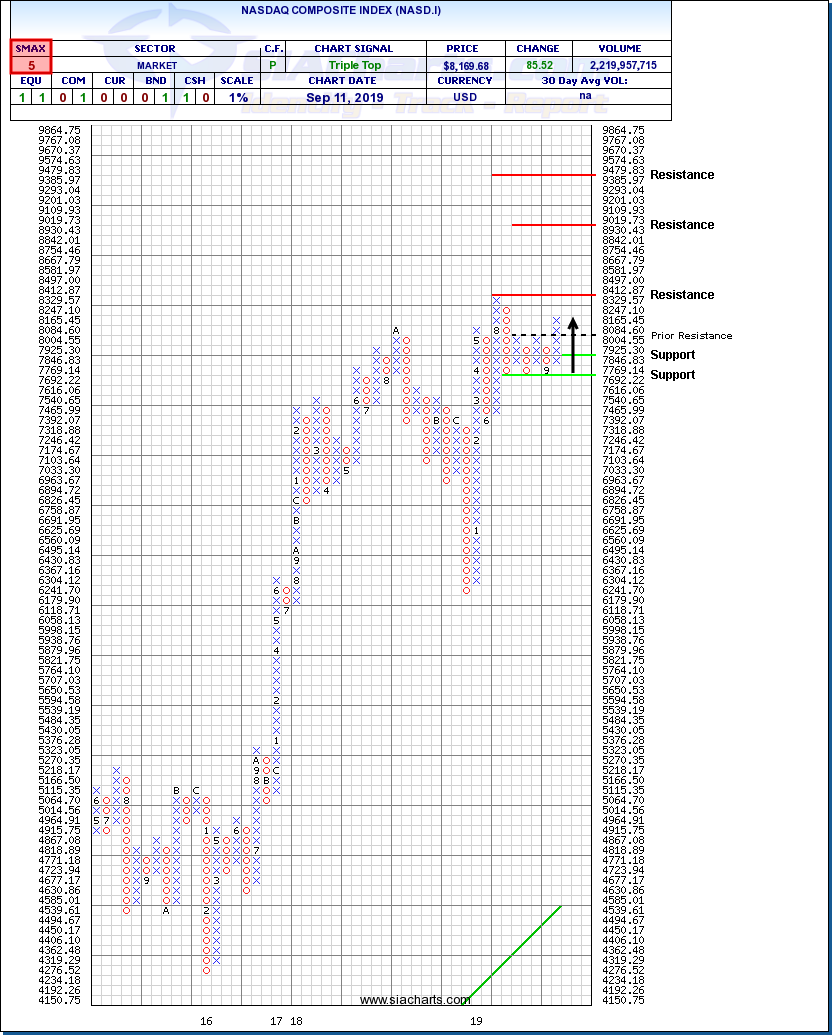
Between December and July, NASD.I staged a very strong recovery rally, not only regaining the ground lost in its late-2018 selloff but carrying on to new highs. The index staged a moderate correction in August but established strong support near 7,700 through multiple tests.
This month, NASD.I has started to resume its primary uptrend. The recent breakout over 8,085 completed a bullish Triple Top to signal the start of a new upleg that would be confirmed if the index can break through its previous high near 8,415. Vertical and horizontal counts suggest potential resistance near 9,020 and 9,480 on trend. Initial support appears near 7,845 based on a 3-box reversal.
Heating Oil Continuous Contract (HO.F)
Energy markets have been particularly active this week. Crude oil contracts have seen strong moves in both directions as investors consider the ramifications of political changes including easing US-China trade tensions (good for demand), and Saudi Arabia appointing a new energy minister from the royal family and preparing to launch the Saudi Aramco IPO soon (which gives them motivation to rein in supply and keep the oil price supported).
These signs which supported the bullish case for oil have been offset, however, by US cabinet changes that have led to speculation the US may be considering a rapprochement with Iran and the potential easing of sanctions which could put some supply back into the market. Even with the market pulling back over the last two days, big weekly drawdowns in US oil inventories of 5.0-7.5 mmbbls (depending on who is counting) provides some underpinning for ongoing support.
Meanwhile, we are starting to see more seasonal movement in some energy contracts. Heating Oil (HO.F), for example, has started to climb on anticipation of higher demand in the upcoming winter home heating season.
The recent breakout over $1.88 completed a bullish Quadruple Top pattern, snapping a downtrend and signalling the start of a new recovery trend. Previous column highs and lows suggest potential upside resistance tests near the $2.00 round number, then $2.14 and $2.23, the last of which coincides with a horizontal count. Initial support appears near $1.85 where a 3-box reversal and prior support/resistance converge.
SIACharts.com specifically represents that it does not give investment advice or advocate the purchase or sale of any security or investment. None of the information contained in this website or document constitutes an offer to sell or the solicitation of an offer to buy any security or other investment or an offer to provide investment services of any kind. Neither SIACharts.com (FundCharts Inc.) nor its third party content providers shall be liable for any errors, inaccuracies or delays in content, or for any actions taken in reliance thereon.


