


by Jeffrey Saut, Chief Investment Strategist, Saut Strategy
Last week on CNBC I stated that maybe what we have is a new toolbox; but nobody knows what new tool to use for analyzing the economy, stock market, bond market, etc. Our friend, CNBC’s uber-smart Steve Liesman, hinted at this point in our interview, but I do not think many folks picked up on it, and it is a very important point. Shortly after that appearance I read this from the astute portfolio manager of Paulsen & Co., John Paulsen:
Adding to current anxieties are the growing fears that businesses may be curtailing spending plans. Real nonresidential investment spending declined in the second quarter for the first time since early 2016. However, this decline was due entirely to ‘old-era investment spending’ while ‘new-era spending’ remains healthy. This distinction is more important than ever in the contemporary recovery because it is the first in which new-era business spending now comprises the biggest share of overall business investment.
Now “new-era spending” is a term I have not really thought about, but it certainly makes sense. Paulsen goes on to note:
The chart (not included due to copyright issues) compares old-era and new-era investment spending since the start of the early-2000s economic recovery in 2002. New-era investment is proxied by spending on information processing equipment and intellectual property products; old-era investment is total nonresidential investment less new-era spending. . . . First, the character of new and old investment spending is strikingly different. Business investment during the post-war period is widely recognized as a highly-volatile GDP component often considered a primary cause of the conventional capitalistic boom/bust cycles. Recent years have been no exception. Old-era business spending boomed during the latter part of the early-2000s economic recovery and busted in the 2008-09 recession. It has shown a similar character in the current recovery - booming early and experiencing significant volatility since 2014. Conversely, new-era investment is typically quite stable, persisting at a healthy growth rate even during periods when old-era spending is volatile. As shown, even during the Great Recession of 2008, new-era business spending suffered only a short and shallow setback before returning to its solid consistent growth pattern.
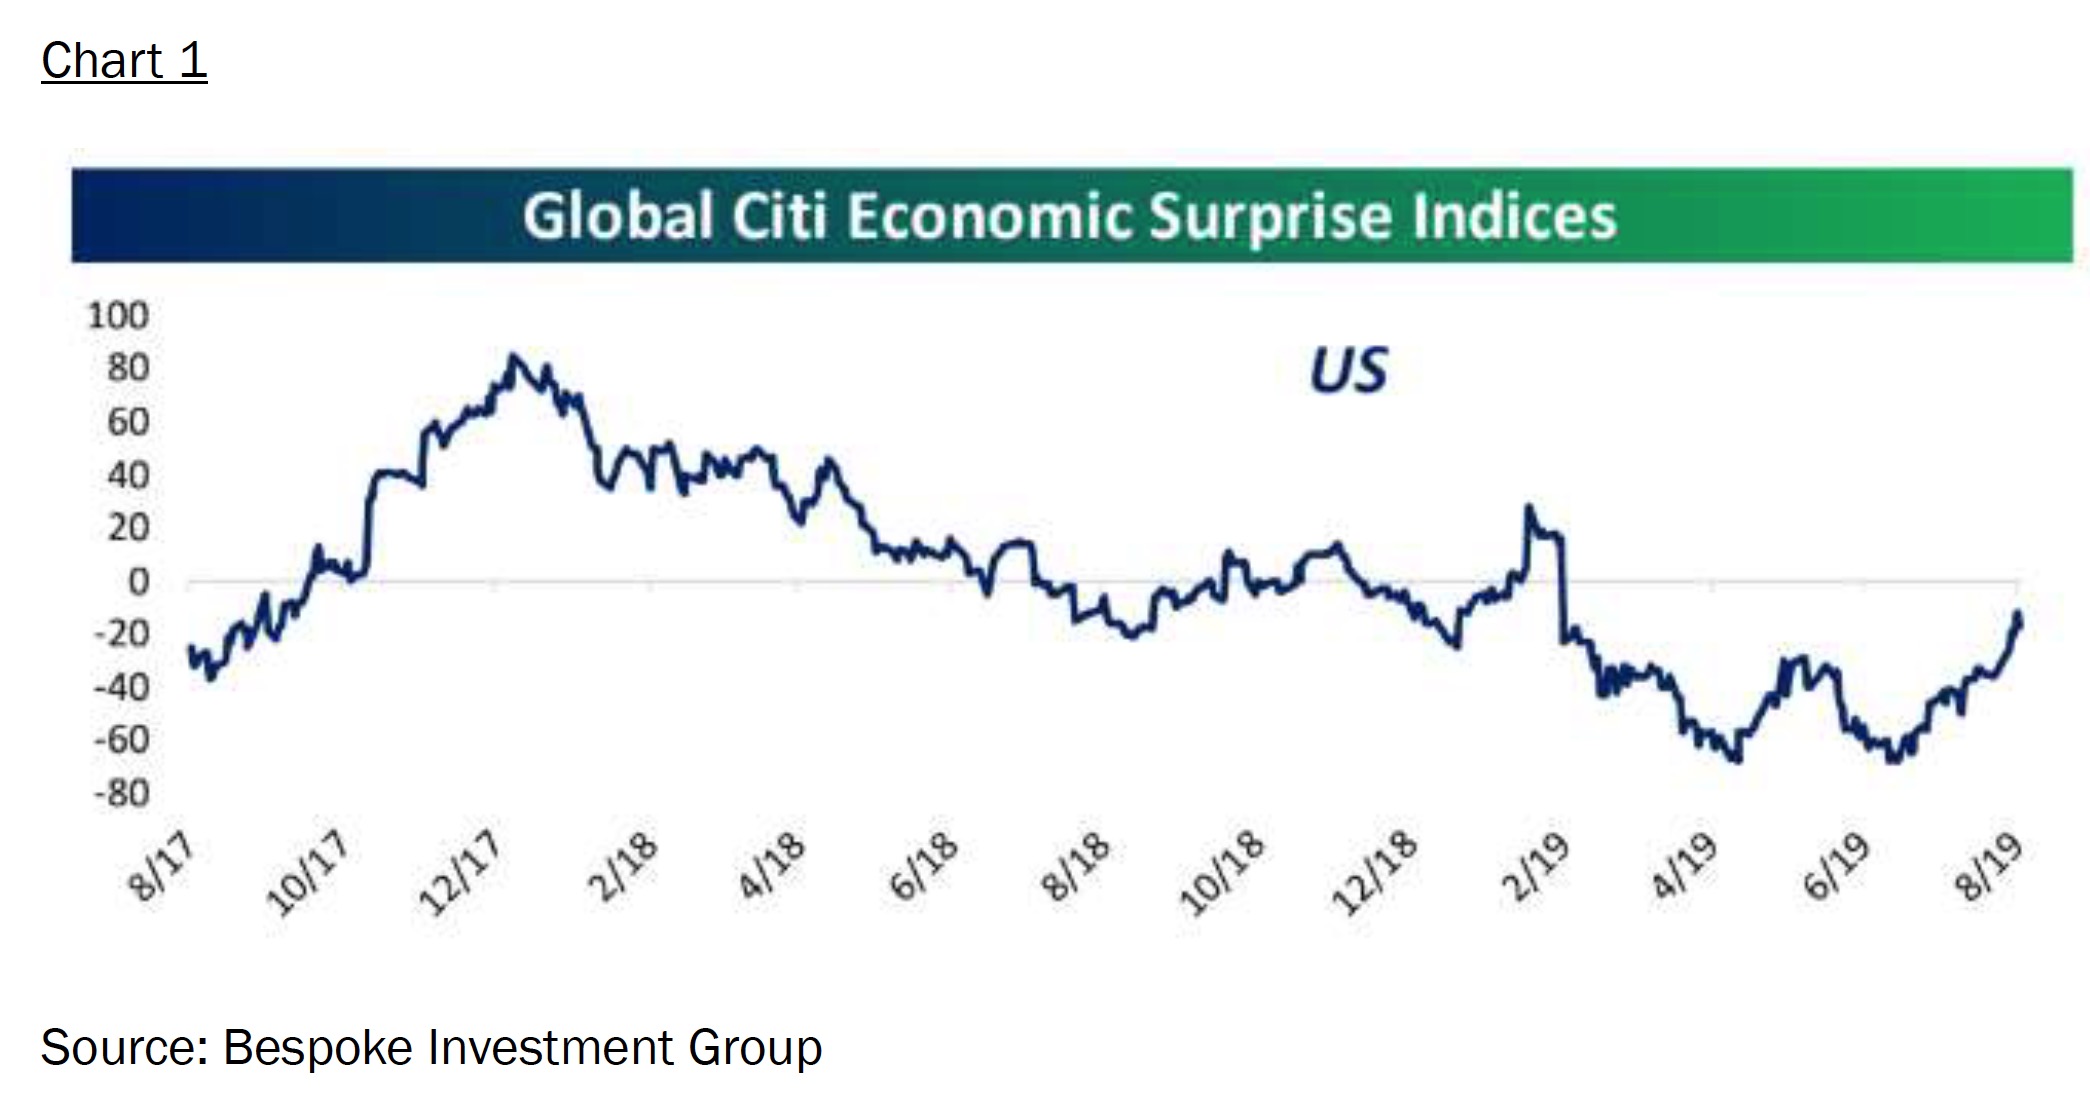
This “new-era versus old-era spending” is not an unimportant point because it implies things like an inverted yield curve may not necessarily mean a recession in looming. Indeed, consumer spending accounts for about two-thirds of the U.S. economy and the consumer is in pretty good shape. Government accounts for roughly 18% of the U.S. economy and it is in good shape. Incomes are rising, employment is strong, housing and auto sales are improving, etc. Much of this news is being in the Citi Economic Surprise Index (chart 1). This “new versus old” also may imply some of the indicators folks use to analyze the stock market may not be the correct “tools.” In my case
while the long-term and intermediate-term proprietary models are still darn accurate, our short-term model has been squirrelly since it flashed a sell signal four weeks ago. It could also explain the stock market’s manic
depression behavior. To wit, there have been so many daily 1% moves in the S&P 500 (one day up and the next day down) that I have lost count of them. Moreover, there were two 90% Downside Days (August 5 and August 14)
with an 80% Upside Day on August 8. Preliminary data suggests last Friday was another 80% Upside Day. Such action is typically how bottoms are made.
Speaking to our models, the long/intermediate-term models remain constructive and the short-term model flipped to a buy signal last Friday. It should also be noted that there was a positive “polarity flip” on Friday. While the
“internal energy” model is not fully charged, there is still enough energy to carry stocks higher. Of interest is that the 2840 – 2850 support level for the S&P 500 (SPX/2888.68) held last week. Of course, the real talk of the town for the week was in the fixed income markets where yields collapsed causing a brief inversion of the 2-year T’note
to the 10-year T’note. This saw the D-J Industrials dive 800-points last Wednesday as the word “recession” echoed down the canyons of Wall Street. Not so, however, from previous Fed Head Janet Yellen who stated that she doubts a recession is in the cards and we agree. We were around when the 30-year T’bond yielded roughly 15% and NOBODY wanted to buy it. Last Thursday the 30-year guy’s yield fell to below 2% and everybody wanted to buy it. We have long argued that participants should not take the action in the bond market as a recession signal. Rather we think it is all about capital flows from the rest of the world seeking a positive interest rate return in an environment where there is $16 trillion of paper with negative interest rates.
Concerning interest rates, we are doing a conference call with our friend, and the best bond portfolio manager we know, namely Bill Kohli who manages several bond funds for Putnam Investments. The one I have owned for over 10 years is the Putnam Diversified Income Trust (PDINX/$6.94). Bill and I will be doing the conference call this coming Wednesday (8-21-19) at 4:15 p.m. To register please using this URL Putnam.
The call for this week: Be certain to dial into the Putnam conference call this Wednesday at 4:15 p.m. ET. As for the equity markets, there has been no Dow Theory “sell signal.” The SPX held the support zone we have repeatedly referenced at 2840 – 2850 last week despite Wednesday’s stock dive. And for those folks emailing us about
another 20% meltdown like late last year consider this. The probability of that is very low because except for twice in the 1930s NO secular bull market has experienced a 19%+ decline within a 12-month timeframe. As we have stated, we think the SPX bottomed with the “selling climax” low of ~2822 on August 5, 2019. We experienced a retest of that low a few sessions later; and, an attempt to do that again last week. We think the lows are “in.” An operational strategy if that scenario is correct would be that proposed by our friends at Riverfront Investment Group:
- Identify the quantity of cash to be put to work.
- Break the trade into digestible chunks (break it into 5 chunks of 20% each).
- Invest the first chunk today.
- Set a date for implementing the future chunks.
- Implement chunks if the market pullback.
One stock for your consideration is Macy’s (M/$15.98) in the depressed retail sector. Macy’s has about $10 per share of value in estimated New York real estate, sells at a forward PE of 5.5x earnings, a price to sales ratio of 0.20, a price to book ratio of 0.78, and a 9.4% dividend yield. This morning the preopening ESUs are sharply higher (+31) as PBOC looks at interest rate reform and Reuters is reporting Huawei wavers to be granted today.
Investing/trading involves substantial risk. The author and Saut Strategy do not guarantee or otherwise promise as to any results that may be obtained from using this report. Past performance should not be considered indicative of future performance. No reader should make any investment decision without first consulting his or her own personal financial advisor and conducting his or her own research and due diligence, including carefully reviewing any prospectus and other public filings of the issuer. These commentaries, analyses, opinions, and recommendations represent the personal and subjective views of the author, and are subject to change at any time without notice. The information provided in this report is obtained from sources which the author believes to be reliable.
Copyright © Saut Strategy


