


by Lance Roberts, Clarity Financial
Over the last 18-months, there has been a continual drone of political punditry touting the success of “Trumponomics” as measured by various economic data points. Even the President himself has several times taken the opportunity to tweet about the “strongest economy ever.”
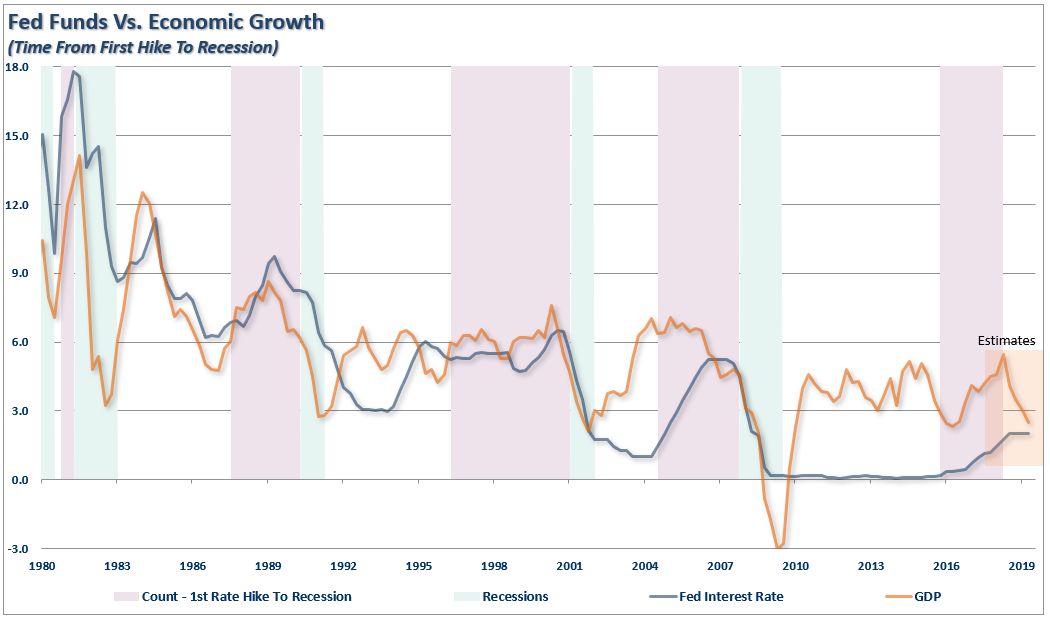
But if it is the “strongest economy ever,” then why the need for aggressive rate cuts which are “emergency measures” to be utilized to offset recessionary conditions?
What the Market wanted to hear from Jay Powell and the Federal Reserve was that this was the beginning of a lengthy and aggressive rate-cutting cycle which would keep pace with China, The European Union and other countries around the world....
— Donald J. Trump (@realDonaldTrump) July 31, 2019
First, it is hard to have an “aggressive rate-cutting cycle” when you only have 2.4% to work with.
Secondly, I am not sure we want to be like China or Europe economically speaking, and running a $1.5 Trillion deficit during an expansion, suspending the debt ceiling, and expanding spending isn’t that much different.
Nonetheless, I have repeatedly cautioned about the risk of taking credit for the economic bump, or the stock market, as a measure of fiscal policy success. Such is particularly the case when you are a decade into the current economic cycle.
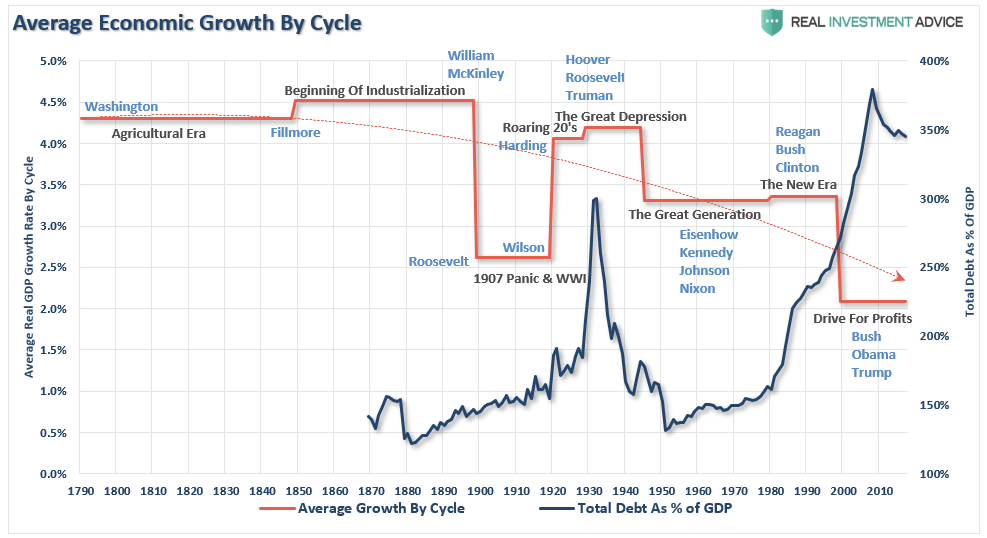
Economic growth is more than just a reported number. The economy has been “in motion” following the last recession due to massive liquidity injections, zero interest rates, and a contraction in the labor force. Much like a “snowball rolling downhill,” the continuation of economic momentum should have been of little surprise.
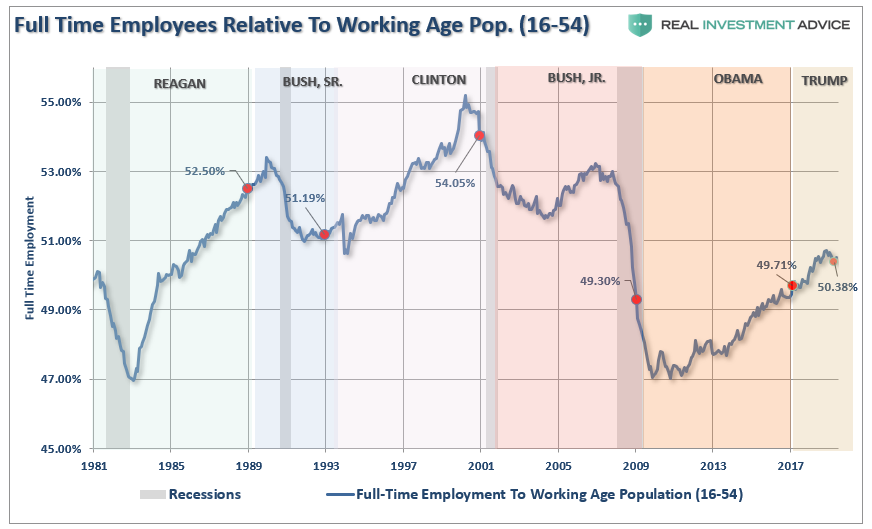
As an example, we can look at full-time employment (as a percentage of 16-54 which removes the “retiring baby boomer” argument) by President. The rise in full-time employment has been on a steady trend higher following the financial crisis as the economic and financial systems repaired themselves.
As discussed previously, economic data is little more than a “wild @$$ guess” when it is initially reported. However, one-year and three-years later, the data is revised to reveal a more accurate measure of the “real” economy.
Unfortunately, we pay little attention to the revisions.
While there are many in the media touting “the strongest economy ever” since Trump took office, a quick look at a chart should quickly put that claim to rest.
Yes, there was a spurt in economic growth during 2018, which did seem to support the claims that Trump’s policies were working. As I warned then, there were factors at play which were obfuscating the data.
“Lastly, government spending has been very supportive to the markets in particular over the last few quarters as economic growth has picked up. However, that “sugar-high” was created by 3-massive Hurricanes in 2017 which has required billions in monetary stimulus which created jobs in manufacturing and construction and led to a temporary economic lift. We saw the same following the Hurricanes in 2012 as well.”
“These “sugar highs” are temporary in nature. The problem is the massive surge in unbridled deficit spending only provides a temporary illusion of economic growth.”
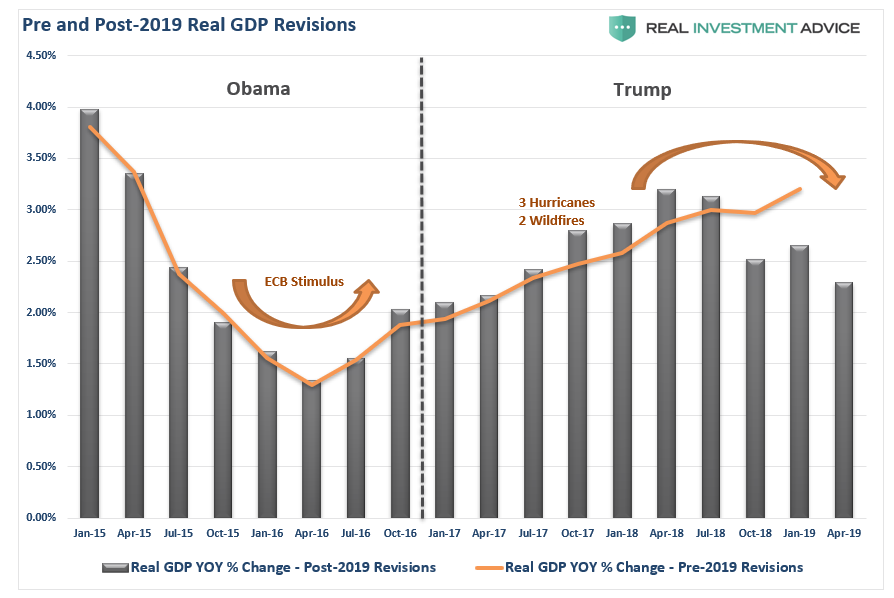
The importance is that economic “estimates” become skewed by these exogenous factors, and I have warned these over-estimations would be reversed when annual revisions are made.
Last week, the annual revisions to the economic data were indeed negative. The chart below shows “real GDP” pre- and post-revisions.
This outcome was something I discussed previously:
“With the Fed Funds rate running at near 2%, if the Fed now believes such is close to a ‘neutral rate,’ it would suggest that expectations of economic growth will slow in the quarters ahead from nearly 6.0% in Q2 of 2018 to roughly 2.5% in 2019.”
However, there is further evidence that actual, organic, economic growth is weaker than the current negative revisions suggest. More importantly, the revisions to the 2019 data, in 2020, will very likely be as negative as well.
This is also the case with the employment data which I discussed previously:
“Months from now, the Establishment Survey will undergo its annual retrospective benchmark revision, based almost entirely on the Quarterly Census of Employment and Wages conducted by the Labor Department. That’s because the QCEW is not just a sample-based survey, but a census that counts jobs at every establishment, meaning that the data are definitive but take time to collect.”
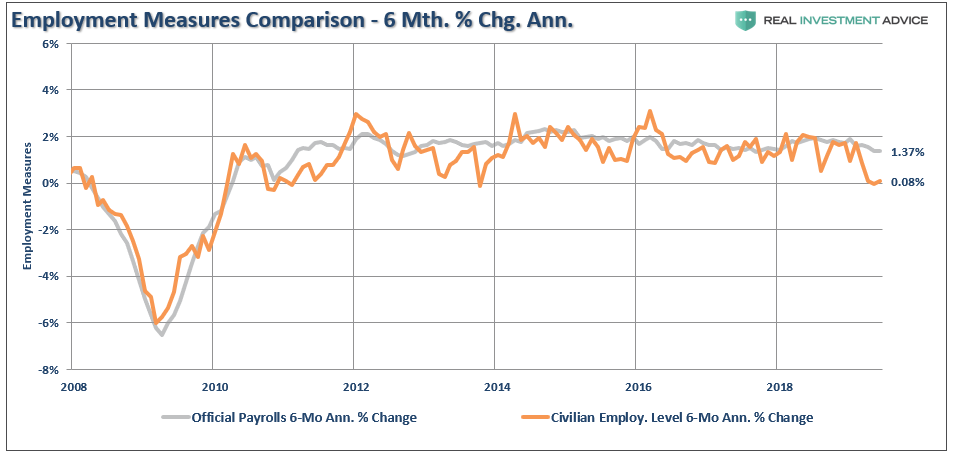
“The Establishment Survey’s nonfarm jobs figures will clearly be revised down as the QCEW data show job growth averaging only 177,000 a month in 2018. That means the Establishment Survey may be overstating the real numbers by more than 25%.”
There is nothing nefarious going on here.
It is the problem with collecting data from limited samples, applying various seasonal adjustment factors to it, and “guesstimating” what isn’t known. During expansions, the data is always overstated and during recessions it is understated. This is why using lagging economic data as a measure of certainty is always erroneous.
Debt-Driven Growth
I recently discussed the “death of fiscal conservatism” as Washington passed another spending bill.
“In 2018, the Federal Government spent $4.48 Trillion, which was equivalent to 22% of the nation’s entire nominal GDP. Of that total spending, ONLY $3.5 Trillion was financed by Federal revenues, and $986 billion was financed through debt.
In other words, if 75% of all expenditures is social welfare and interest on the debt, those payments required $3.36 Trillion of the $3.5 Trillion (or 96%) of revenue coming in.”
The “good news” is, if you want to call it that, is that Government spending does show up in economic growth. The “bad news” is that government spending has a negative “multiplier” effect since the bulk of all spending goes to non-productive investments. (Read this)
Nonetheless, the President suggests we are “winning.”
What the Market wanted to hear from Jay Powell and the Federal Reserve was that this was the beginning of a lengthy and aggressive rate-cutting cycle which would keep pace with China, The European Union and other countries around the world....
— Donald J. Trump (@realDonaldTrump) July 31, 2019
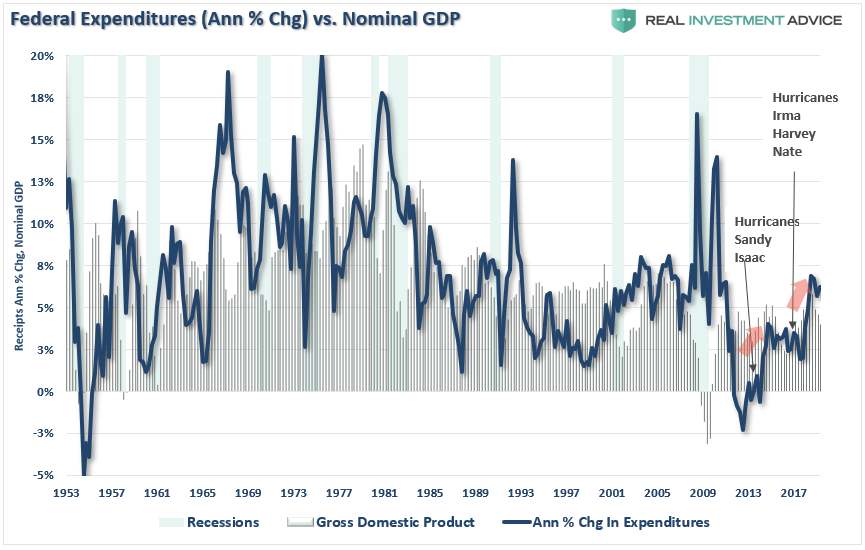
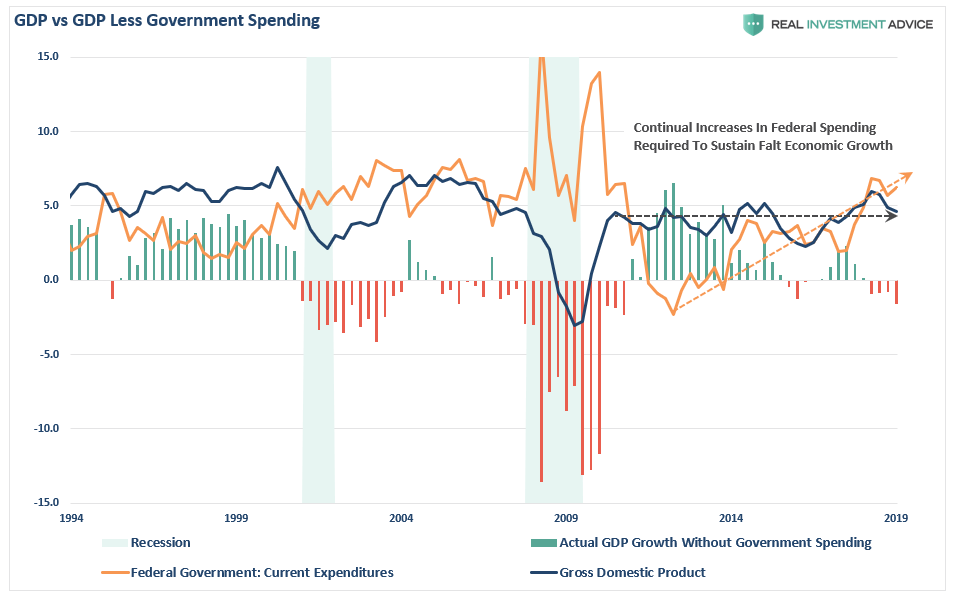
The problem is that economic growth less government spending is actually “recessionary.”
As shown in the chart below, since 2010 it has taken continually increases in Federal expenditures just to maintain economic growth at the same level it was nearly a decade ago. Such a “fiscal feat” is hardly indicative of “winning.”
As Mike Shedlock noted, part of the issue with current economic estimates is simply in how it is calculated.
In GDP accounting, consumption is the largest component. Naturally, it is not possible to consume oneself to prosperity. The ability to consume more is the result of growing prosperity, not its cause. But this is the kind of deranged economic reasoning that is par for the course for today.
In addition to what Tenebrarum states, please note that government transfer payments including Medicaid, Medicare, disability payments, and SNAP (previously called food stamps), all contribute to GDP.
Nothing is “produced” by those transfer payments. They are not even funded. As a result, national debt rises every year. And that debt adds to GDP.”
This is critically important to understand.
While government spending, a function of continually increasing debt, does appear to have an economic benefit, corporate profits tell a very different story.
The Real Economy
I have been noting for a while the divergence between “operating earnings” (or rather “earnings fantasy”) versus corporate profits which are what companies actually report for tax purposes. From “Earnings Growth Much Weaker Than Advertised:”
“The benefit of a reduction in tax rates is extremely short-lived since we compare earnings and profit growth on a year-over-year basis.
In the U.S., the story remains much the same as near-term economic growth has been driven by artificial stimulus, government spending, and fiscal policy which provides an illusion of prosperity.”
Since consumption makes up roughly 70% of the economy, then corporate profits pre-tax profits should be growing if the economy was indeed growing substantially above 2%.”
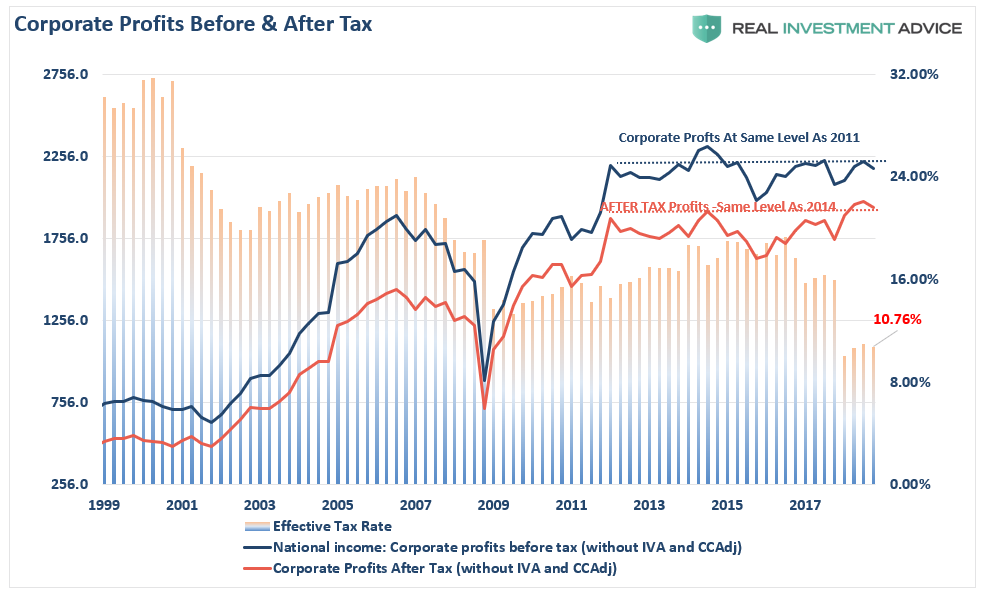
We now know the economy wasn’t growing well above 2% and, as a consequence, corporate profits have been revised sharply lower on a pre-tax basis.
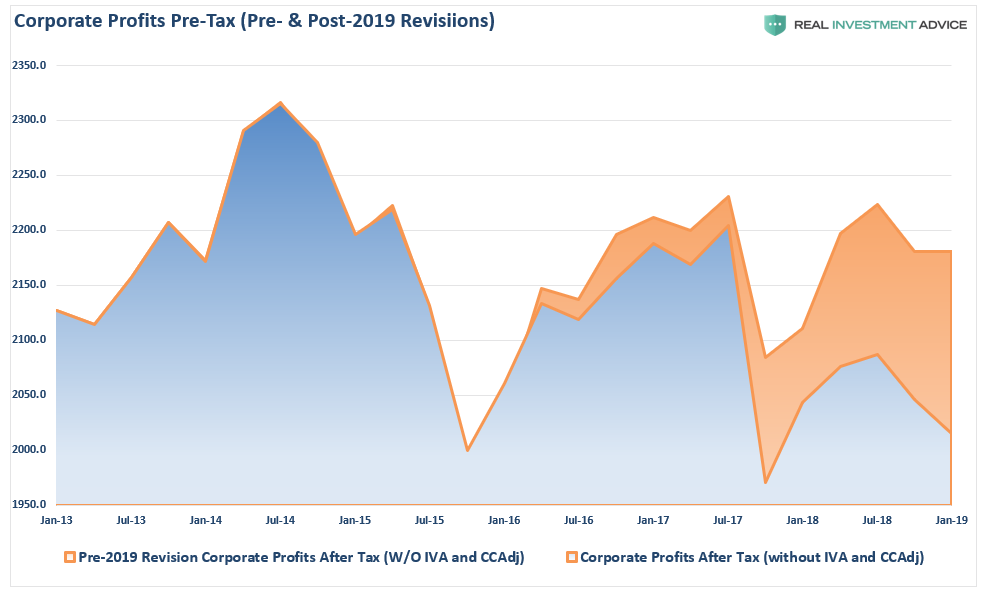
The reason we are looking at PRE-tax, rather than post-tax, profits is because we can see more clearly what is actually happening at the corporate level.
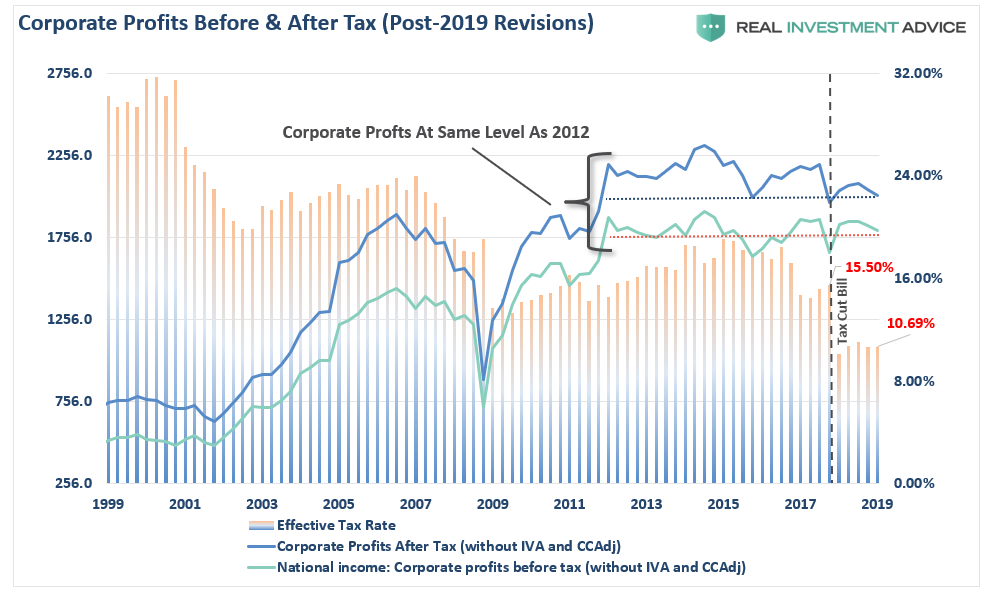
Since corporate revenues come for the sale of goods and services, if the economy was growing strongly then corporate profits should be reflective of that. However, since 2014, profits have actually been declining. If we take the first chart above and adjust it for the 2019-revisions we find that corporate profits (both pre- and post-tax) are the same level as in 2012 and have been declining for the last three-years in particular.
Again, this hardly indicates the “strongest economy in history.”
These negative revisions to corporate profits also highlight the over-valuation investors are currently paying for asset prices. Historically, such premiums have had rather horrific “paybacks” as markets eventually “reprice” for reality.

Trump’s Political Risk
While the media is quick to attribute the current economic strength, or weakness, to the person who occupies the White House, the reality is quite different.
Most fiscal, and monetary, policy changes can take up to a year before the impact shows in the economic data. While changes to “tax rates” can have a more immediate impact, “interest rate” changes take longer to filter through.
The political risk for President Trump is taking too much credit for an economic cycle which was already well into recovery before he took office. Rather than touting the economic numbers and taking credit for liquidity-driven financial markets, he should be using that strength to begin the process of returning the country to a path of fiscal discipline rather than a “drunken binge” of spending.
With the economy, and the financial markets, sporting the longest-duration in history, simple logic should suggest time is running out.
This isn’t doom and gloom, it is just a fact.
Politicians, over the last decade, failed to use $33 trillion in liquidity injections, near zero interest rates, and surging asset prices to refinance the welfare system, balance the budget, and build surpluses for the next downturn.
Instead, they only made the deficits worse and the U.S. economy will enter the next recession pushing a $2 Trillion deficit, $24 Trillion in debt, and a $6 Trillion pension gap which will devastate many in their retirement years.
While Donald Trump talked about “Yellen’s big fat ugly bubble” before he took office, he has now pegged the success of his entire Presidency on the stock market.
It will likely be something he eventually regrets.
“Then said Jesus unto him, Put up again thy sword into his place: for all they that take the sword shall perish with the sword.” – Matthew 26, 26:52
Copyright © Clarity Financial