by Liz Ann Sonders, Senior Vice President, Chief Investment Strategist, Charles Schwab & Co
Key Points
- Debt/deficits continue to be the most-discussed topic at client events; so we recently did an internal deep dive on the subject.
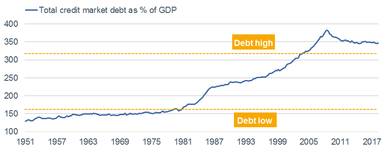
- Total credit market debt sits at an astounding 350% of U.S. GDP (albeit down from 380% pre-financial crisis).
- MMT surprisingly has adherents on both sides of the political aisle; but the reality is we can’t stay on this debt path indefinitely.
I am part of Schwab’s Asset Allocation Working Group—the group which, among other things, formulates our tactical asset allocation recommendations. As most readers know, I lead the charge on recommendations associated with the U.S. equity market. As a reminder, we are currently neutral on U.S. stocks overall; within which we have an overweight to large caps and an underweight to small caps. But in addition to discussing these recommendations and proposed updates thereto, we also spend a lot of time as a group doing “deep dives” on myriad topics of interest to us and Schwab’s investors.
The latest deep dive we covered was on a topic that remains top of mind for investors based on my travels and visits with our investors (especially during Q&A sessions at events at which I’ve spoken). Although politicians seem to be whistling past the debt yard, the deficit and debt remain at the top of the list of longer-term concerns of our investors.
This report will be an inside look at what we covered during our debt deep dive. I want to give a shout-out to my new research associate, Kevin Gordon, for his assistance with this project, his presentation of some of its components during our meeting, and his contribution to this report.
Starting with the conclusion
We are firm believers that high and growing debt is a burden on economic growth. Regardless of the cavalier attitude toward debt in Washington—on both sides of the political aisle—and the recent bipartisan focus on Modern Monetary Theory (MMT), we are not swayed from the view that high and rising debt has a “crowding out” effect on the economy (more on MMT later in this report).
Although this report will focus on the United States, and federal debt in particular, we are not on an island with regard to profligacy. In the 10 years that followed the Global Financial Crisis (GFC), global financial debt rose from $97 trillion to $169 trillion, according to McKinsey & Company; while the International Monetary Fund (IMF) warns that high global debt threatens to exacerbate global economic downturns.
“Only” 350%
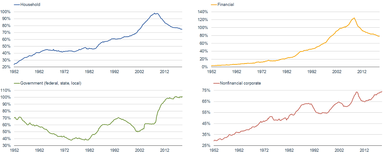
The most comprehensive measure of U.S. debt—total credit market debt (TCMD)—is every measurable form of debt across the government, corporate and household spectrum. The first chart below shows that TCMD has been in the “high” zone since 2004; having spent about 30 years in the low debt zone between the early-1950s to early-1980s. You can see that TCMD has come down to about 350% from about 380%—not that anyone should be cheering! That decline has been courtesy of deleveraging by both households and financial corporations; while government and nonfinancial corporate debt have been on an upward trajectory. (My colleague Collin Martin did a deep dive on corporate debt, and has prodigiously written on corporate debt, and will continue to do so.)
Proof?
The Ned Davis Research table below the first chart is the “proof statement” with regard to the impact of a high (and rising) debt burden on the economy. There is a noticeable and consistent difference across a spectrum of economic/inflation/productivity variables between the low debt and high debt zones. Nominal and real GDP, payroll growth, inflation, capex and productivity have all been lower when debt is high than when debt is low.
Debt Down From Peak But Still Stratospheric

Source: Charles Schwab, FactSet, Ned Davis Research (NDR), Inc. (Further distribution prohibited without prior permission. Copyright 2019(c) Ned Davis Research, Inc. All rights reserved.), as of March 31, 2019.
Domestic Credit Market Debt Components (as % of nominal GDP)
Source: Charles Schwab, FactSet, Federal Reserve, as of March 31, 2019.
Longer but weaker cycles
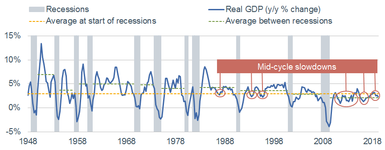
The shift up in the TCMD ratio since the early 1980s may help to explain why the trajectory of U.S. economic growth looks quite a bit different since the early-1980s than it did prior to that. The blue line in the chart below is simply the path of U.S. real gross domestic product (GDP) in the post-WWII era; with the gray bars marking recessions. The yellow dotted line shows the average of TCMD over the period; while the more important dotted line is the green one, which shows the average of each expansion cycle. As you can see, since the late-1950s the expansion average has been consistently ticking down vs. the prior cycle.
Weaker expansion cycles have allowed expansions to last longer (i.e., there has been more space between recessions) because excesses take longer to build with sub-par growth. But it also means the economy has been much more susceptible to mid-cycle slowdowns than in past eras. There are other non-debt burden reasons for this change—globalization and demographics among them—but excessive debt has undoubtedly been a contributor.
Longer But Weaker Cycles Recently
Source: Charles Schwab, Bureau of Economic Analysis, FactSet, as of June 30, 2019.
Debt is the cumulative effect of running budget deficits
It’s amazing to me how often I hear folks (including our politicians…on both side of the aisle) conflate the terms deficit and debt. The latter is the cumulative effect of running the former. As you can see in the chart below, per Congressional Budget Office (CBO) projections, the U.S. budget deficit is expected to exceed $1 trillion each year starting in 2022; with deficits likely to be well above the 50-year average. Outlays are expected to jump to 23% of GDP by 2029, from 20.8% this year due to demographics and rising health care costs.
Federal Budget Looking Ahead

Source: Charles Schwab, CBO (Congressional Budget Office) May 2, 2019 Report: Updated Budget Projections: 2019 to 2029.
Flow Chart for Debt Reduction
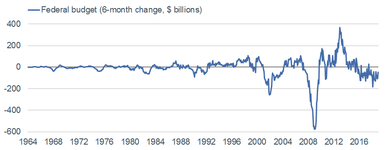
A simple breakdown of the change in the deficit shows that economic growth (using The Conference Board’s Coincident Economic Indicators—the indicators used to date recessions) and payroll growth is decidedly higher when the six-month change in the budget deficit is improving vs. worsening.
Rolling 6m Change in Deficit

Source: Charles Schwab, Bloomberg, Ned Davis Research (NDR), Inc. (Further distribution prohibited without prior permission. Copyright 2019(c) Ned Davis Research, Inc. All rights reserved.), as of June 30, 2019.
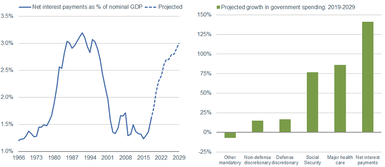
In addition, spending on Social Security and Medicare is expected to ramp up, with net interest costs driven by rising debt—even if interest rates remain low (the CBO assumes the rate of interest on federal debt will go from 2.4% in 2019 to 4.2% in 2049). You can see that in the left chart below; with the right chart showing that the projected growth in government spending on net interest payments is expected to swamp the growth rate of spending on pretty much everything else.
Net Interest Payments to Swamp Everything Else
Source: Charles Schwab, CBO (Congressional Budget Office) May 2, 2019 Report: Updated Budget Projections: 2019 to 2029.
A tall order
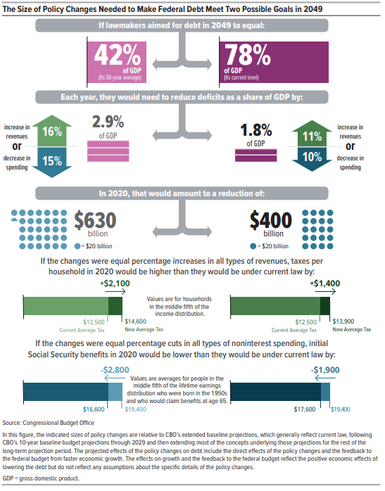
The reduction in the deficit needed to reduce federal government debt is hefty. Below is a handy graphic from the CBO with two federal debt goal paths—42% of GDP, which is the 50-year average; and 78% of GDP, which is the current level. Readers who would like to dive even deeper, here is the link to the CBO’s “2019 Long-Term Budget Outlook:” https://www.cbo.gov/system/files/2019-06/55331-LTBO-2.pdf
The other side of the argument: MMT
Once a hot topic and polarizing debate among our country’s lawmakers, managing the growth in federal debt has obviously become less important in Washington. It used to be the (generalized) domain of the left to progressively tax and spend, while the right generally pushed for smaller deficits and a tighter fiscal approach. Yet, both parties now seem to err on the side of spending more and having relatively little (if any) concern about ballooning deficits and the surge in federal debt.
There are myriad theories positing ways to “manage” debt and deficits—chief among them being Modern Monetary Theory (MMT). Although there is nothing terribly modern about it—the line of thinking has been around for over a century—it has garnered much more media attention in recent years. In turn, many high profile officials in Washington have adopted either the full theory or some version of it. MMT advocates argue that the U.S. government’s ability to control its own currency bestows upon it the power to spend freely and aggressively. By working in close coordination with the Federal Reserve, the U.S. Treasury Department can print money on demand; with any resulting inflation handled by tax policy, according to the theory.
As you can imagine, critics have been quick to challenge MMT for its lack of concern regarding inflation; not to mention its assumption that taxation would be an elixir for any sudden spike in prices. Equally as large a fear is the potential crowding out of private investment; which MMT supporters negate, since the government’s creation of bank reserves through spending should effectively lower interest rates. Yet, lost in that rebuttal is the reality that government-directed investment of finite resources would likely contribute to a dwindling supply.
To quote my friend Jason Trennert, founder of Strategas Research Partners:
“Ultimately, economics is the study of allocating scarce resources. While it is true that we can now spend money we don’t have, it is also true that if this were a reliable path to prosperity, no country would ever lose its reserve currency status. The civilizations based in Athens, Rome, Constantinople, Florence, Amsterdam, Madrid, and London all learned this painful lesson the hard way. In this way, there’s nothing particularly modern about Modern Monetary Theory.”
In sum
I’m often asked when we’re likely to “hit the debt wall.” The reality is we already hit a debt wall in 2008, when the housing debt bubble burst and brought the entire global financial system down with it. It set households and financial corporations down a path of deleveraging, but the same can’t be said for the government (or nonfinancial corporations). Ideally, economic growth exceeds debt growth on a consistent basis such that we can start chipping away at the problem.
Until then, we may be in an era of rolling debt crises—not just in the United States, but globally as well. The bottom line is a high and rising burden of debt crowds out more productive investments and negatively impacts economic growth. This is not prospective; this is what our economy has been weighed down by for decades and there’s no “end game” in sight.
Copyright © Charles Schwab & Co


