
by Martin Small, Blackrock
Municipal bonds have seen record flows in 2019. Martin talks to head of BlackRock’s municipal strategy about some of the reasons why.
Martin: Sean, first set the stage for us. Munis have been on a tear this year. What’s behind it?
Sean: I would say the most obvious driver has been a very strong technical market. The demand for municipal bonds, primarily from retail, has been nothing short of sensational. We’ve seen $52 billion in flows from January through the week ended July 17. That has been coupled with eight months of positive performance going back to November of 2018, as interest rates began to fall. Year to date through July 24, municipal bonds are up 5.80% and up 8.35% since November 2018, as measured by the Bloomberg Barclays Municipal Bond Index.
Martin: These are historic flow numbers, aren’t they?
Sean: They certainly are! We’re just better than halfway through 2019 and we’ve never experienced a weekly average near this year’s of $1.8 billion; from an annual flow perspective this year represents the strongest year of flows since 2009, according to the Investment Company Institute. And there’s no sign they’re abating.
Martin: Where is the demand coming from?
Sean: The principal driver has been retail investors, whether through separately managed accounts (SMA’s), mutual funds, exchange traded funds (ETFs) or direct purchase. These are the “natural” buyers of the asset class and the one you want supporting valuations, so it’s quite welcome. It also suggests that growth can continue. In contrast, if trades were being fueled by non-traditional investors, we would expect to see greater price volatility, as these “renters” of the asset class tend to change strategy more often.
Importantly, this surge in demand has coincided with a slowing in municipal bond issuance both on the gross but more importantly on the net figure.
Martin: What role has U.S. tax reform played, if any?
Sean: Tax reforms have actually supported demand from retail investors, after a year where we witnessed institutional owners (~25% ownership) right-size their allocations. Consider that the most meaningful tax benefit went to the corporate sector, which saw its effective tax rate reduced 14%, to 21%. For individuals, the top marginal tax rate came down only 2.6%. And when you factor in the limited deductions at the state and local level, many people saw their tax obligations increase. That has made muni tax exemptions even more attractive, and in some ways has “reset” the standard for muni-to-Treasury ratios.
Martin: There’s this misperception that municipal bonds are a tax haven, something just for the top 1% of earners. Talk about why the math simply doesn’t bear that out.
Sean: That’s right. If we compare municipal bonds to corporates, you’ll see that on a tax-adjusted basis munis out-yield comparable corporates all the way down to the 24% tax bracket. So the benefits have been quite broad, in that while munis have acted as a great diversifier within a portfolio, they are also attracting a broader audience. What’s more, munis typically offer higher quality and lower volatility than many corporate counterparts. These qualities, together with competitive returns, are important to a lot of investors, particularly now when we’re late in the economic cycle.
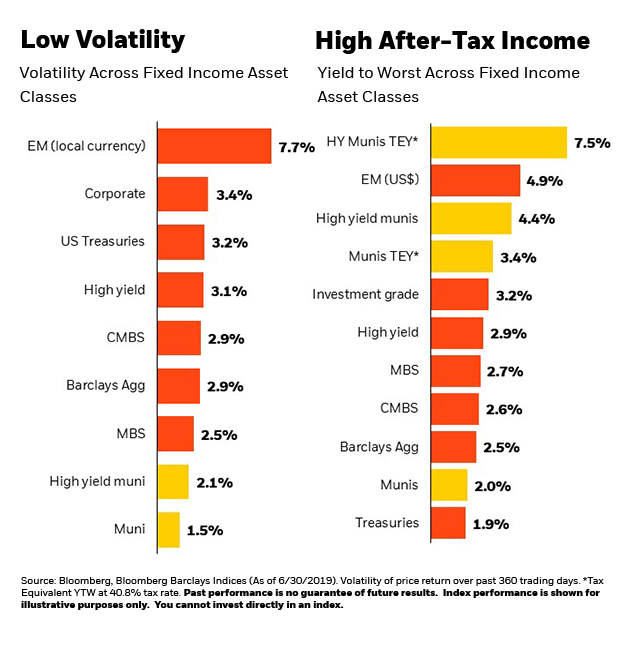
Please see below for specific Bloomberg Barclays indexes.
Martin: Last question. As the head of BlackRock’s municipal strategy team, what kinds of things do you look out for?
Sean: While the market environment varies, one constant is that I’m always digging through the data looking to challenge crowded trades or the status-quo, as these tend to offer little value and liquidity is one-way. An example of something I look at is issuance. A net-negative issuance environment by definition strengthens the technical backdrop, as there are simply not enough high-quality fixed income assets to satisfy demand. The impact on returns can be significant: Since 2008, the years in which net supply has been negative have averaged returns of 5.05%, vs. 3.64% in years with net positive supply. (Source: BlackRock, Bloomberg Barclays Municipal Bond Index.)
Another thing is reading over-subscription levels on primary new issues across the entire yield and credit curve, which helps me understand how to be positioned from a duration, credit and liquidity standpoint. I also look at state level data to forecast fiscal health or new technology, which helps me quickly identify holdings in an area experiencing wild fires, flooding and hurricanes.
Trying to discover the next trend or trade is what I love about this role and quite honestly, is what our clients expect and deserve from us. We sit in a unique seat at BlackRock. Using our scale and the data and tools at our disposal to help create alpha on a daily basis is the backbone of the entire team.
Martin: Thank you, Sean. This has been great.
Read BlackRock’s latest Municipal Market Insight.
Martin Small is the Head of U.S. U.S. Wealth Advisory and a regular contributor to The Blog.
Representative Bloomberg Barclays indexes in chart: CMBS Investment Grade Index; EM Local Currency Government Index; EM USD Aggregate Index; Municipal Bond Index; Municipal High Yield Index; U.S. Aggregate Index (Agg); U.S. Corporate Index (Corporate, Investment grade); U.S. Corporate High Yield Index; U.S. MBS Index; U.S. Treasury Index.
Investing involves risk, including possible loss of principal.
Fixed income risks include interest-rate and credit risk. Typically, when interest rates rise, there is a corresponding decline in bond values. Credit risk refers to the possibility that the bond issuer will not be able to make principal and interest payments.
There may be less information on the financial condition of municipal issuers than for public corporations. The market for municipal bonds may be less liquid than for taxable bonds. Some investors may be subject to Alternative Minimum Tax (AMT). Capital gains distributions, if any, are taxable.
Investment comparisons are for illustrative purposes only.
Index performance is for illustrative purposes only. Index performance does not reflect any management fees, transaction costs or expenses. Indexes are unmanaged and one cannot invest directly in an index. Past performance does not guarantee future results.
This material is not intended to be relied upon as a forecast, research or investment advice, and is not a recommendation, offer or solicitation to buy or sell any securities or to adopt any investment strategy. The opinions expressed are as of the date indicated and may change as subsequent conditions vary. The information and opinions contained in this post are derived from proprietary and non-proprietary sources deemed by BlackRock to be reliable, are not necessarily all-inclusive and are not guaranteed as to accuracy. As such, no warranty of accuracy or reliability is given and no responsibility arising in any other way for errors and omissions (including responsibility to any person by reason of negligence) is accepted by BlackRock, its officers, employees or agents. This post may contain “forward-looking” information that is not purely historical in nature. Such information may include, among other things, projections and forecasts. There is no guarantee that any of these views will come to pass. Reliance upon information in this post is at the sole discretion of the reader.
This post contains general information only and does not take into account an individual’s financial circumstances. This information should not be relied upon as a primary basis for an investment decision. Rather, an assessment should be made as to whether the information is appropriate in individual circumstances and consideration should be given to talking to a financial advisor before making an investment decision.
©2019 BlackRock, Inc. All rights reserved. BLACKROCK is a registered trademarks of BlackRock, Inc., or its subsidiaries in the United States and elsewhere. All other marks are the property of their respective owners.
USRMH0719U-908110-1/1
This post was first published at the official blog of Blackrock.