by Liz Ann Sonders, Senior Vice President, Chief Investment Strategist, Charles Schwab & Co
Key Points
- Friday, the S&P crossed 3k; which followed the Dow’s 27k cross and the NASDAQ’s 8k cross last month; with small caps not in gear.
- Round numbers are more psychological than technically-important and have helped boost most measures of investor sentiment back into optimistic territory.
- Round number cheering is being accompanied by rate cut cheering, with stocks (perversely?) cheering weaker economic news in the interest of easier monetary policy.
As a preface to this week’s report, I want to remind readers that for the past two years we have been tactically recommending that investors keep their overall U.S. equity exposure neutral (or in line) with their long-term strategic allocations; but to overweight U.S. large cap stocks and underweight U.S. small cap stocks.
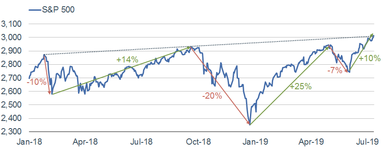
The past 18 months or so have kept stock market riders on the roller coaster. Each successive high in the S&P 500 has been slightly higher than the prior high, but with limited headway made overall, as you can see in the chart below. The latest new high for the S&P, as well as for the Dow Jones Industrial Average (Dow), crossed another pair of round number thresholds—3000 and 27,000, respectively (the NASDAQ crossed 8,000 last month). As for the limited headway, the S&P is less than 5% above its January 2018 high.
Is This the Real Breakout?
Source: Charles Schwab, Bloomberg, as of July 12, 2019.
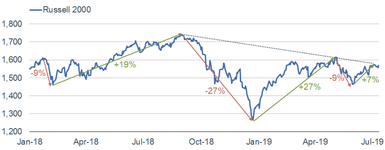
The story for smaller cap stocks is decidedly less compelling. Since peaking at the end of August last year, each successive peak in the Russell 2000 has been lower, as you can see in the chart below. It remains about 10% below its August 2018 peak. Although we may be getting close to a compelling valuation discount by small caps relative to large caps, for now we are sticking with the recommendation to overweight large caps at the expense of small caps.
Small Caps Lagging Behind
Source: Charles Schwab, Bloomberg, as of July 12, 2019.
Round numbers
Do all of these round numbers mean anything technically or are they purely psychological? Unless they happen to correspond to other key technical milestones, crossing round numbers is more psychological—no doubt hyped by hats on the New York Stock Exchange emblazoned with “Dow 27k.”
Let’s look a little deeper at the latest psychological character of the market; while keeping in mind that investor sentiment—notably at extremes—tends to be a contrarian indicator. I keep my eye on myriad investor sentiment measures, including SentimenTrader’s “Smart Money/Dumb Money” Confidence measures, the Crowd Sentiment Poll (CSP) from Ned Davis Research (NDR), and the weekly survey from the American Association of Individual Investors (AAII).
Smart Money Getting Less Optimistic
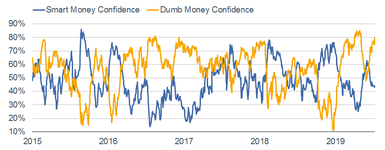
SentimenTrader (ST) looks at various investor cohorts’ behaviors and segments them into their so-called “Smart Money” and “Dumb Money” constituents. The former (especially at extremes) is generally the non-contrarian indicator; while the latter is generally the contrarian indicator. You can see the wide spread—when “dumb money” optimism moved well above “smart money” optimism—that marked the S&P’s peaks in January 2018 and April 2019 (less so in September 2018). You can also see the wide spread—when “smart money” was at an extreme of optimism and “dumb money” was at an extreme of pessimism—that marked the S&P’s low in December 2018.
“Dumb Money” Chasing Rally … “Smart Money” Not So Much
Source: Charles Schwab, SentimenTrader, as of July 12, 2019.
Although we are not yet looking at an extreme spread like existed just ahead of the 7% correction in the S&P 500 during May, if it continues to widen, it might represent a short-term risk for stocks.
Crowd Sentiment
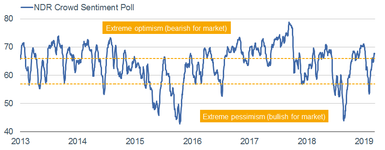
As regular readers know, I like the Ned Davis Research Crowd Sentiment Poll because it’s an amalgamation of about seven distinct sentiment measures—including both attitudinal and behavioral measures. As you can see in the chart (and accompanying table) below, optimism has followed the stock market higher, and is now back in the “extreme optimism” zone. In that zone historically, as you can see in the table, stocks have tended to struggle on an annualized basis.
Crowd Sentiment Inching Back to Extreme Territory
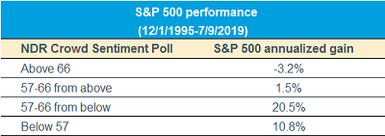
Source: Charles Schwab, Ned Davis Research (NDR), Inc. (Further distribution prohibited without prior permission. Copyright 2019(c) Ned Davis Research, Inc. All rights reserved.), as of July 9, 2019.
Not all sentiment measures are stretched
One of the aforementioned seven sentiment measures imbedded in the CSP is the survey conducted weekly by the American Association of Individual Investors (AAII). This is currently one of the more subdued sentiment readings—with the percentage of AAII members that are bullish no worse than about neutral, as you can see in the chart below. The yellow dots on the chart represent points when the Dow crossed round number thresholds. As you can see, Dow 25k and Dow 26k were accompanied by much higher bullishness than Dow 27k. This is a sentiment measure the bulls can continue to cheer.
AAII Bulls Less Impressed
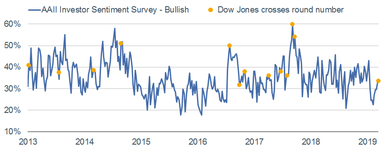
Source: Charles Schwab, American Association of Individual Investors (AAII), Bloomberg, as of July 12, 2019.
Latest round numbers took fairly long
As reported by The Wall Street Journal, it took 216 days for the S&P 500 to move from its first cross above 2900 (last August) to its first cross above 3000 (last Friday)—which is one of the longest stretches between round numbers in quite a few years. As noted by ST, because it gets easier for the index to hurdle each round number as it climbs (the percentage change is less), it’s been rare to see a streak this long since the S&P first surpassed 600 in the mid-1990s. For what it’s worth, subsequent returns were generally better after long stretches between round numbers than shorter stretches.
Don’t fight the Fed
Another factor impacting sentiment has been monetary policy—in particular, the likelihood that the Federal Open Market Committee (FOMC) cuts the fed funds rate by 25 basis points at the end of this month. Long-time readers know that the phrase “Don’t fight the Fed” was coined by my first boss/mentor, the late-great Marty Zweig. That message has been in full force recently; leading many to conclude that we have moved from the original “Greenspan put” to the “Powell put.” That view kicked in when, in January this year, the Fed shifted from a hawkish to a dovish stance following the market rout into the December 2018 low. It’s based on the belief that the Fed has the power—and will use it—to keep the stock market in ascent.
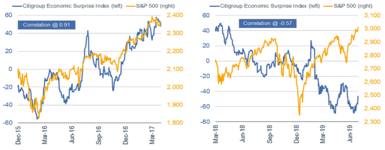
This belief is perhaps why we have seen a sharp change in the market’s reaction to and behavior around economic data surprises. Take a look at the charts below—the left chart covers the first 16 months of the Fed’s rate tightening cycle (beginning in December 2015), and the second of which dates from March 2018 to the present. Citi’s Economic Surprise Index tracks how economic data is coming relative to expectations (it’s not a measure of the level of growth).
Stocks “Cheering” Weaker Economic Data
Source: Charles Schwab, Bloomberg, as of July 12, 2019.
Early in the Fed’s tightening cycle (i.e., the first 16 months), markets generally cheered better economic news—at that point not fearing the Fed would tighten policy too much—and the correlation was a wildly positive 0.91. Fast-forward to the most recent 16-month period and it’s a mirror image, with the correlation moving into negative territory to the tune of -0.57—meaning when the data has been getting worse relative to expectations, stock have generally moved higher, and vice versa.
Sentiment in summary
As noted above, stocks have been cheering weaker economic news in the interest of monetary policy stepping in to provide a floor under stocks. This could continue; but at some point, either the market will catch down to weaker economic data, or economic data will have to catch up to a strong stock market.
ST sums up the past year as such: During the peak-failure-panic cycle from September through December 2018, stocks followed the typical sentiment cycle—suggesting months of digestion. Stocks subsequently rallied much more than usual, but so far the pattern is mostly holding, suggesting a choppy path higher. We continue to see choppy market action ahead, with sentiment possibly signaling another leg down if it gets to an extreme.
Copyright © Charles Schwab & Co


