
by Jeffrey Saut, Saut Strategy
7-15-19 – I entered this business in 1971 on a trading desk in New York city. Since then I have been a trade desk manager, a retail stock broker, branch manager, analyst, portfolio manager, Director of Research at five different firms, and head of Capital Markets at three firms.
As such, I used to do reviews on the analysts. One of the questions I asked those analysts in said review was, “Do you look at the charts of the companies you have in your research coverage?” I would say over 50% of them would say no. “Why not,” I would reply. Their answers were far ranging, but the gist of their message was they think that charts are tantamount to voodoo.
If that is true, then why do 95% of the portfolio managers (PMs) you call on pull up a chart of the stock you are pitching to them? To that statement there was generally no response, so I will tell you why. It is because that is the world they live in.
The PMs are looking at the charts because they are trying to determine if what the analyst is telling them is being reflected in the price of the company. Indeed, when you can be measured to the second decimal point every morning it becomes an extremely humbling business!
Over my nearly 49 years in this business there has been a running battle between fundamental analysts and technical analysts. However, my father used to say, “Son, you need to use both charts and fundamentals. It’s like words and music.” As our colleague Andrew Adams wrote in his insightful Charts of the Week report last Wednesday:
“Modern technical analysis encompasses enough information to fill ‘door stopper-sized’ textbooks (just go check out Amazon for proof). The discipline has expanded considerably over the last several decades to include hundreds of different methods, indicators, and chart patterns, as well as aspects of related fields such as intermarket analysis, behavioral finance, and statistics.
Yet, the field’s origins go back at least to the 17th and 18th centuries when Dutch and Japanese traders/merchants would use basic charting techniques to keep track of prices. It was an easier way to visualize the data through time and helped practitioners in their dealings back when markets weren’t nearly as efficient or ‘observable’ as they are today.
I mention this history because given all the sophisticated tools at our disposal here in 2019, it can be very easy to veer too far away from the traditional spirit of price charting. At the end of the day, we’re just trying to figure out if something is more likely to go up or more likely to go down, and it is more of an art than a science (yes, it’s an overused cliché but that doesn’t mean it’s not true).
In short, the goal is to try to keep the probabilities in our favor as best we can using the past and our limited understanding of human nature as a guide.” Andrew also mention mentioned some stocks for your potential “buy lists.” Those names were: CIEN, CYBR, GS, IQ, and LSCC.
This morning’s diatribe was brought back to memory after reading this quip from the astute Marc Faber: “Already early in my career, I realized that one of the problems of technical analysis was the interpretation of charts.
Nonetheless, I became attracted to the field because I observed that stock, bond and commodity prices would often suddenly move in a direction and investors would scratch their heads as to why these moves occurred. Only much later, would changing fundamentals confirm the validity of the earlier price moves. In other words, prices moved ahead of fundamentals and especially ahead of analysts' projections.
Therefore, I believe that investors can benefit from looking at long- and short-term charts. In particular, investors should pay attention to major up-side or down-side breakout points - especially, when these breakout moves occur against the majority of investors' expectations.”
Speaking of breakouts, last week saw an upside breakouts in many of the indices (INDU, NDX, WLSH, etc.} we monitor as we anticipated. That’s why we issued this Trading Flash last Monday evening: “Despite today’s Dow 116-point decline this looks like merely an upside consolidation; and, a bullish one! Prices tagging new highs with NO real trend, is highly bullish.”
At the time of that Trading Flash the S&P 500’s intraday Monday low was at ~2970, as of last Friday’s intraday high the S&P was changing hands at ~3013 closing near the S&P 500’s (SPX/3013.77) intraday high of 3013.92, which was a new all-time high. The D-J Industrials (INDU/27332.03) did just about the same thing and closed at a new all-time high. That action sparked many of our incoming emails to ask, “Is this a Dow Theory ‘buy signal’?” Unfortunately, at least by our method of interpreting Dow Theory, it is not because the Transports failed to confirm. Still, an upside breakout, is a breakout, is a breakout! Also registering upside breakouts were many of the individual stocks we have discussed. CareDX (CDNA/$38.33), Inphi (IPHI/$58.75), and Zymeworks (ZYME/$24.00) all broke out to the upside during the week before settling back late week. And, if you question our positive spin on the Financials look at Goldman Sachs’ (GS/$213.94) upside chart breakout (chart 1).
What is interesting to us is that stocks are rallying despite last week’s terrible Treasury auction that caused the 10-year T’note’s yield to rise from its recent intraday low of 1.94% to last Friday’s intraday high of 2.148%. Likewise, the 30-year T’bond’s yield rose from 2.466% to 2.670% over the same timeframe (chart 2). While that does not sound like much, it is HUGE in the fixed income markets!
Turning to industry groups, our colleague Harry Katica wrote in last Friday’s report:
“With many Industry Groups near 52-week highs, there are several that can play catch-up if they can deliver decent Q2 results. Autos have been plagued with higher inventories and sluggish sales, though several of the Auto Dealers such as Autonation (AN) and Carmax (KMX) are at 52-week highs. GM would be my pick for a trade.”
The call for this week: Earnings season begins this week and will see its zenith over the two weeks starting July 22. Earnings expectation have been ratcheted lower, so many are predicting choppy stock market action over this earnings period. We are not so sure. Yes, the stock market is short-term overbought and there was a trader’s “sell signal” on July 11 when, “Lowry’s Short Term Index completed a drop of six or more points from its most recent high.” Yet the Advance-Decline Line continues to make new all-time highs and our models are aligned to the upside. And, while our internal energy model is marginally lower from its recent energy peak there is still plenty of energy to carry stocks higher. As our pal Leon Tuey writes:
“Thanks, Jeffrey. As shown in my recent report, many of the market indices are showing the same bullish patterns - VTI, $WLSH, $NYA, etc. It's like "shooting fish in the barrel". Yet, investors remain hypernervous. Despite the spectacular off the December bottom and the market's record highs, there is no celebration, no cheers (see table from AAII below). Amazing! As mentioned, this bull will continue to surprise all on the upside.”
This morning the preopening S&P 500 futures are better by 5-points as China reports the weakest economy in 27 years.
Chart 1
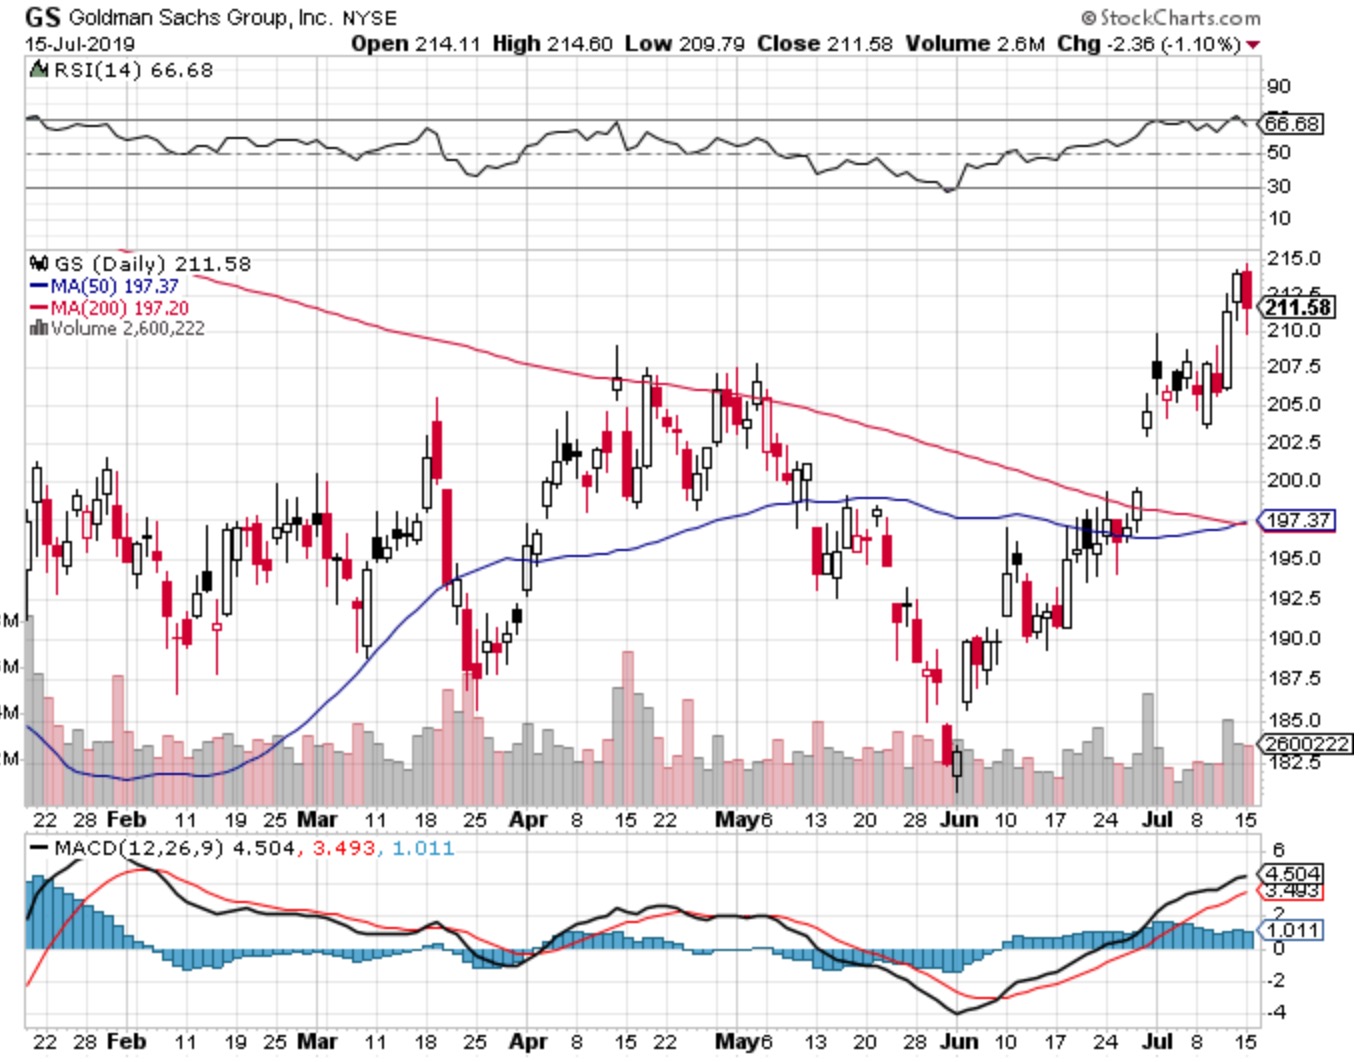
Source: Stockcharts.com
Chart 2
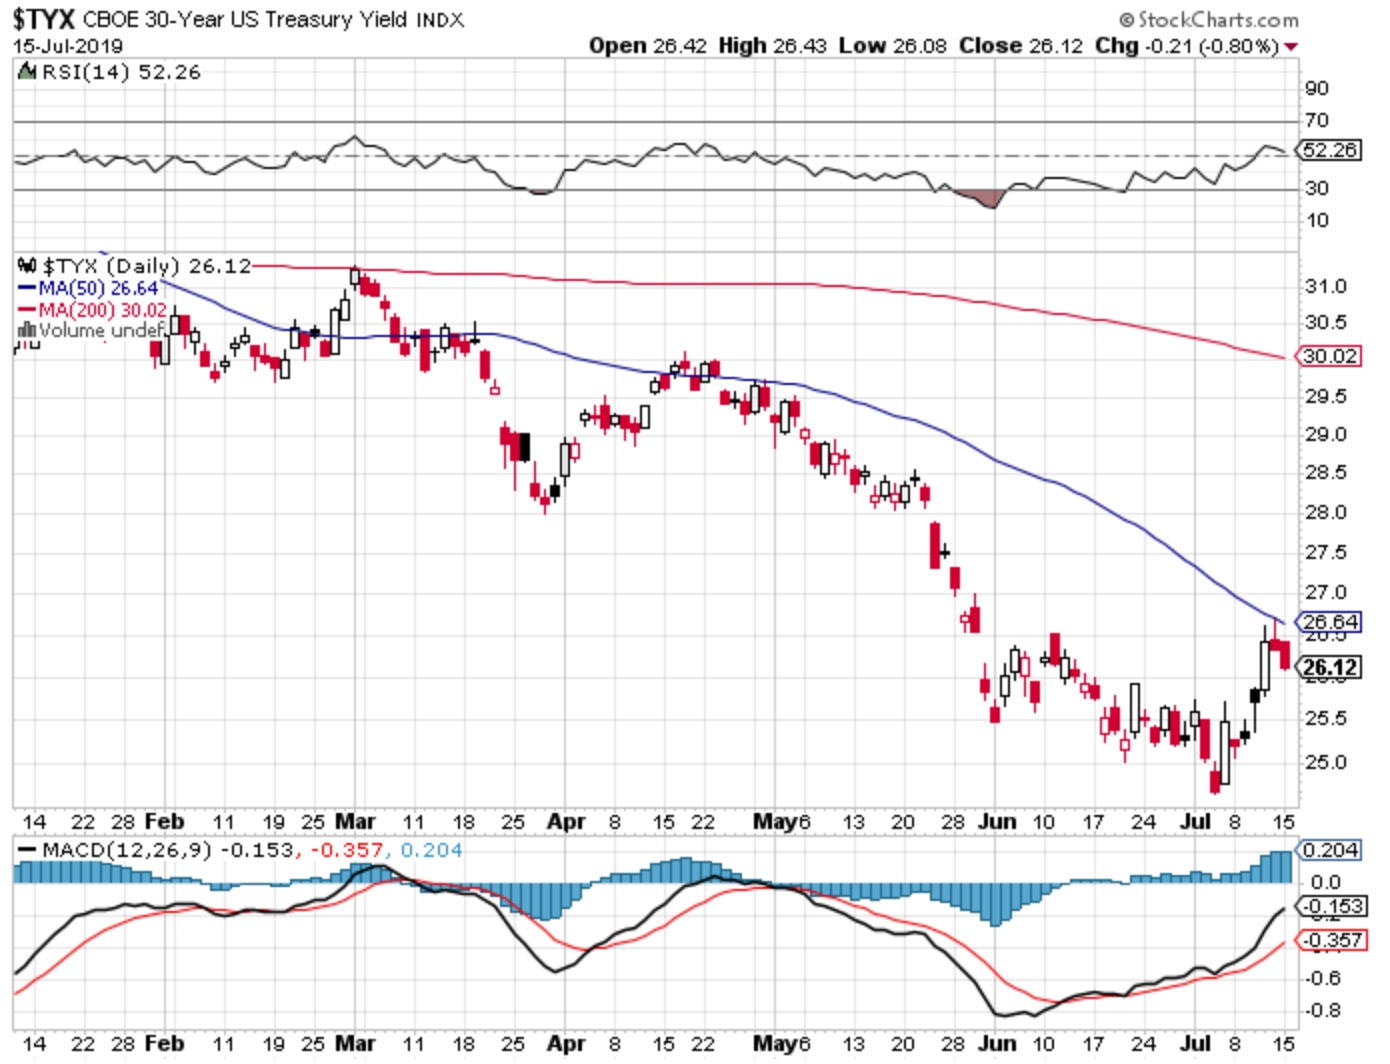
Source: Stockcharts.com
Investing/trading involves substantial risk. The author and Saut Strategy do not guarantee or otherwise promise as to any results that may be obtained from using this report. Past performance should not be considered indicative of future performance. No reader should make any investment decision without first consulting his or her own personal financial advisor and conducting his or her own research and due diligence, including carefully reviewing any prospectus and other public filings of the issuer. These commentaries, analyses, opinions, and recommendations represent the personal and subjective views of the author, and are subject to change at any time without notice. The information provided in this report is obtained from sources which the author believes to be reliable.
Copyright © Jeffrey Saut