by Jeffrey Kleintop, Senior Vice President and Chief Global Investment Strategist, Charles Schwab & Co., Inc.
Key Points
- Valuations suggest international stocks may produce above average, double-digit annualized total returns over the next 10 years, in contrast to below average, mid-single digit returns for U.S. stocks.
- At current valuations, both U.S. and international stocks have produced positive long-term annualized returns in the past—an important fact to keep in mind given heightened short-term risks to the stock market.
- International stocks could provide stronger returns in the decade ahead, earning their place in the portfolios of long-term investors.
We recently published the 2019 Mid-Year Global Outlook which included the chart below on how the inversion of the U.S. Treasury yield curve suggests that international stocks may finally begin to outperform U.S. stocks as we look out over the next 10 years. This may surprise many investors after 10 years of U.S. stock market outperformance (since the last inversion in 2008).
Changes in U.S. and international performance trends around yield curve inversions
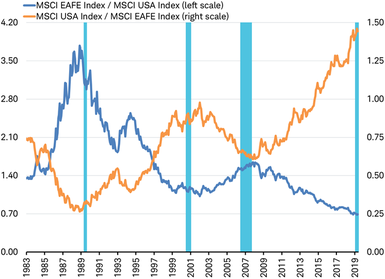
Shaded areas mark periods when the U.S. yield curve was inverted (3 month to 10 year)
Source: Charles Schwab, Factset data as of 6/30/2019.
While past yield curve inversions signaled the reversals in the long-term trend of relative performance between U.S. and international stocks, valuation may be the key factor that drives the mean reversion in long-term relative performance. So what do valuations currently suggest about the potential amount of relative outperformance by international stocks?
Forecasting performance
Forecasting short-term stock market performance is very difficult and prone to many surprises. Fortunately, as we plan our retirements, forecasting long-term performance is much easier by comparison. For example, a commentary published on June 3 from Liz Ann Sonders featured a chart that depicts a tight long-term relationship between U.S. households’ equity allocation and the next 10 year returns for the S&P 500 Index. Currently, it points to annualized mid-single digit total return for U.S. stocks over the next 10 years—a positive, but below-average return.
Unfortunately, we can’t do the same thing for international stocks since comparable household equity allocation data doesn’t exist for international investors. However, for both the U.S. and international stock markets, we have historical price-to-earnings (PE) valuation, which also does a good job of showing a long track record of predicting the next ten year return for stocks. When the PE is high, long-term returns tend to be lower and vice-versa. It makes sense that PE valuation would work just as well since household stock allocation and valuation both measure investor sentiment toward the stock market, which tends to be overly optimistic ahead of periods of weaker investment performance.
The next 10 years
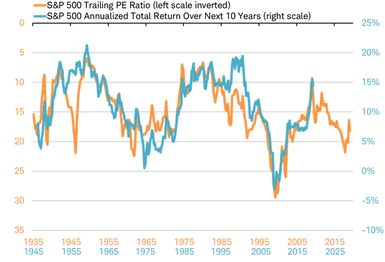
For the United States, the chart below shows that the higher the PE (inverted scale on the chart) the lower the long-term return. It points to about a 7% annualized total return for U.S. stocks. Again, this is a positive total return, but below the long-term average of around 10%.
U.S. stocks PE and performance
Source: Charles Schwab, Factset data as of 7/7/2019.
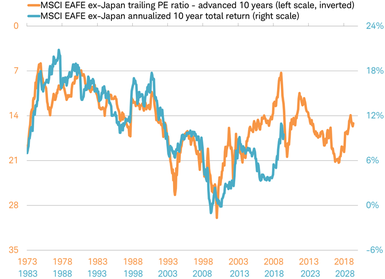
Now, let’s compare this to international stocks using the available data going back to the 1970s for comparison. The PE for international stocks points to an annualized 11% total return, as you can see in the chart below. This suggests a double-digit and above-average total return for international stocks over the coming 10 years that is well above the 7% for U.S. stocks.
International stocks PE and performance
Source: Charles Schwab, Factset data as of 7/7/2019.
For international stocks we are using the MSCI EAFE ex-Japan Index, an international developed market index which excludes Japan. Because there are historical periods where Japanese companies collectively have had negative earnings, a PE ratio is not able to be calculated for those quarters. Since only the periods when Japan’s earnings were positive are included in the MSCI EAFE Index, it results in wide short-term swings in this index’s PE ratio as Japan’s PE came out and then back in to the index. For our long-term historical comparison here, using the MSCI EAFE ex-Japan Index is more useful in measuring the trend in international stock market valuation. Now, the PE for the MSCI Japan Index is also below average, similar to the MSCI EAFE Index.
Does it still work?
As you can see in the international PE and performance line chart above, the relationship between PE and performance didn’t work very well from 2005 to 2008 as the housing bubble and financial crisis that originated in the U.S. spread around the world and pulled international stock market returns below the levels suggested by its PE. Now that 10 years have passed since the end of the 2008-09 financial crisis, the PE and performance lines appear to be reconnecting.
If so, this may lead to a return to the predictive power of this nearly 50 year relationship for international stocks after a few years of divergence, in comparison to the steadily predictive relationship of valuations and S&P 500 Index performance.
A different look
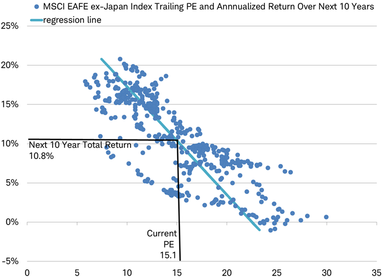
Another way to look at this relationship is in the scatter plots below. A linear regression suggests that the U.S. might produce a 7.8% return over the next 10 years given the current trailing PE of 18.2. Although, it is worth noting that there has been a large spread of historical returns around that 18.2 PE over the past 85 years.
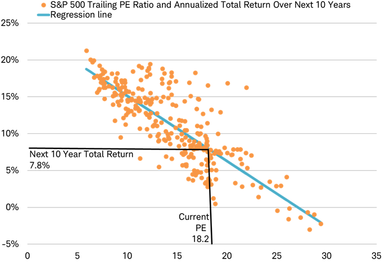
Source: Charles Schwab, Factset data as of 7/7/2019.
The same analysis for international stocks suggests they may produce a 10.8% return given the current trailing PE of 15.1, as you can see in the scatter plot below.
Source: Charles Schwab, Factset data as of 7/7/2019.
Three percentage points of annualized outperformance by international stocks might not sound like much, but it is a big difference to compound annually over 10 years.
A grain of salt
Valuation is often counter-intuitive since it tells us almost nothing about short-term performance and may even mean little to the long-term performance of an individual stock. But, over the long-term, it has been very useful in forecasting the performance for entire stock markets.
Although valuation has historically worked well to forecast long-term returns, producing a remarkable track record since the 1930s, it offers no guarantee that it will continue to work in the future. It’s worth noting that the range of returns around the linear regressions is wider than the difference between the forecasted returns for U.S. and international stocks.
Yet, it is encouraging that at current valuations both U.S. and international stocks have produced positive long-term annualized returns—an important fact to keep in mind given heightened short-term risks to the stock market. And that international stocks could provide stronger returns in the decade ahead, earning their place in the portfolios of long-term investors.
Copyright © Charles Schwab & Co., Inc.


