by Scott Brown, Ph. D., Chief Economist, Raymond James
All right, one more time. Tariffs raise costs for U.S. consumers and business, disrupt supply chains, invite retaliation, and undermine business fixed investment. Is the impact of tariffs showing up in the data? Some, but we haven’t fully felt the impact of the May 10 escalation. Anecdotal evidence suggest a greater impact – enough to slow the economy more significantly, but not enough to push us into a recession. However, the economic outlook, and in turn Fed policy, hinges on what happens in trade policy from here.
[backc url='https://advisoranalyst.com/2019/07/08/martin-gagnon-what-do-investors-want.html/']Don’t look for evidence of a tariff impact in the quirky merchandise trade data. Import and export figures are notoriously volatile (on a monthly and a quarterly basis). A narrowing of the trade deficit added 0.9 percentage point to GDP growth in 1Q19 (as Fed Chair Powell noted, inventory and trade data “are not generally reliable indicators of ongoing momentum.” Advance figures for May showed a widening of the trade deficit. While we’re missing June data (and May figures are subject to revision), it appears likely that net exports will subtract from 2Q19 GDP growth.
Trade policy uncertainty is a negative factor for capital spending. Businesses will be less likely to expand and hire new workers. Orders for nondefense capital goods ex-aircraft have slowed. This may partly reflect issues in energy explorations and problems at Boeing, but it is consistent with increased uncertainty in the global economic outlook. The monthly payroll figures (a coincident economic indicator), while choppy, suggest a slower trend in job growth. Some of that could be trade-related, but it more likely reflects tighter labor market conditions. Jobless claims are a leading economic indicator, and are still trending at a low level. However, job layoff announcements have been trending somewhat higher this year.
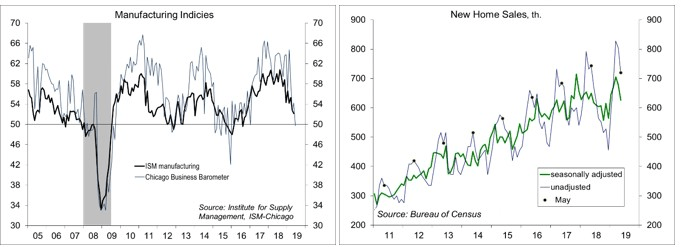
Anecdotally, tariffs and trade policy uncertainty appear to be undermining confidence. Consumer and business surveys have noted increased anxiety about tariffs. The Conference Board’s Consumer Confidence Index fell to 121.5 in the initial estimate for June, down from 131.3 in May and the report noted that “the escalation in trade and tariff tensions earlier this month appears to have shaken consumers’ confidence.” The Chicago Business Barometer edged into contraction territory in June. The survey included a special question about the impact of tariffs, and “80% of firms said that they were negatively impacted, with tariffs raising prices of their goods leading to a pullback in orders.”
While some trade can be expected to shift to other countries (Vietnam, for example), none provides the scale of production that China does. It’s difficult and costly to secure alternative supply chains. The trade spat between the U.S. and China is also dampening global economic growth in general, although trade isn’t the only issue in the global outlook.
Even with the May 10 escalation, tariffs appear likely to subtract only about half a percent from U.S. economic growth this year. The incoming data ought to provide a clearer picture, but it’s not about expectations – it’s about the risks.
Data Recap – The economic data reports were mixed, but generally consistent with moderate growth in the near term. Consumer confidence and the Chicago Business Barometer fell, and both reports cited an impact from tariffs. The report on durable goods appeared to confirm a soft patch in the factory sector. Consumer spending figures were consistent with a strong rebound in 2Q19, following a soft first quarter (a moderate pace if you average the two quarters).
Chairman Powell said that “the Fed is insulated from short-term political pressures” and that he was “particularly impressed” by comments that tight labor markets were finally benefiting those in low- and middle-income communities. As in his post-FOMC press conference, Powell noted that cross-currents (including trade developments and concerns about global growth) have reemerged.
Real GDP rose at a 3.1% annual rate in the 3rd estimate for 1Q19 (vs. +3.1% in the 2nd estimate and +3.2% in the advance estimate. Consumer spending growth was revised down to a 0.9% annual rate (vs. 1.3% in the 2nd estimate), while business fixed investment was revised up to 4.4% (vs. +2.3%). Annual benchmark revisions will be released (along with the advance estimate of 2Q19 GDP growth) on July 26.
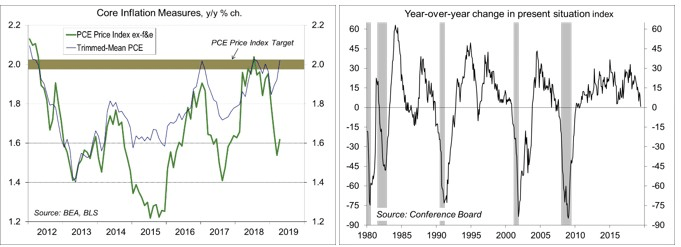
Personal Income rose 0.5% in May (+4.1% y/y). Aggregate wages & salaries rose 0.2% (+3.6% y/y). Personal Spending rose 0.4% (+4.2% y/y), restrained by a 3.2% drop in gasoline sales (lower prices) – ex-gasoline, sales rose 0.5%. Adjusted for inflation, spending rose 0.2% (+2.7% y/y) – on track for about a 3.7% annual rate in 2Q19, vs. +0.9% in 1Q19 (that works out to a 2.3% average for the first half of the year). The PCE Price Index rose 0.2% (+1.5% y/y), up 0.2% ex-food & energy (+1.6% y/y, vs. the Fed’s goal of 2.0%).
The Conference Board’s Consumer Confidence Index fell to 121.5 in the initial estimate for June, down from 131.3 in May (revised from 134.1). Evaluations of the present situation and expectations both fell sharply. Job market perceptions deteriorated (still strong by historical standards). The year-over-year change in the present situation composite, a general indicator of recession, fell to 0.9%. The report noted that “the escalation in trade and tariff tensions earlier this month appears to have shaken consumers’ confidence.”
The University of Michigan’s Consumer Sentiment Index slipped to 98.2 in June, down from 100.0 in May, but little changed from the mid-month estimate (97.9). The report noted that “June's small overall decline was entirely due to households with incomes in the top third of the distribution, who more frequently mentioned the negative impact of tariffs, cited by 45%, up from 30% last month.” Looking ahead, “while more negative trade news will act to decrease consumer spending, the persistent overall strength in consumer confidence is still consistent with growth of real personal consumption expenditures by 2.5% during the next twelve months.”
Durable Goods Orders fell 1.3% in the advance estimate for May, with a downward revision to April (now -2.8%), reflecting a further decline in aircraft orders. Transportation orders fell 4.6% (motor vehicles +0.6%, civilian aircraft -28.2%, defense aircraft -15.3%). Ex-transportation, orders rose 0.3%, after falling 0.9% over the three previous months. Orders for nondefense capital goods ex-aircraft, rose 0.4%, following a 1.0% decline in April, with shipments up 0.7% -- a softer trend than in 1Q19. Unfilled orders fell 0.5% (-0.2% ex-transportation), consistent with a softening in overall factory output.
The Advance Economic Indicators report was mixed. The merchandise trade deficit widened to $x billion (vs. $x billion). With two months of data in hand, it looks like net exports will subtract from 2Q19 GDP growth. Inventories rose a bit more than expected, suggesting a smaller drag on GDP growth than was anticipated before the report.
The Chicago Business Barometer fell to 49.7 (mildly in contraction territory) in June, vs. 54.2 in May. The employment gauge was consistent with mild job growth, but other components declined. On a quarterly basis, the production index fell 15.5%, to a three-year low. Order backlogs fell for the second month. Inflation pressures picked up, with “anecdotal evidence of tariffs leading to higher prices.”
New Home Sales fell 7.8% (±14.7%) in the initial estimate for May, to a 626,000 seasonally adjusted annual rate, down 3.7% (±15.0%) y/y. Unadjusted sales for March-May were up 6.6% y/y (Northeast -11.1%, Midwest +0.0%, South +7.0%, West +12.2%). Monthly home sales figures are unreliable, but there is an underlying story. Higher mortgage rates dampened sales in 4Q18 (-13.2% y/y). The drop in mortgage rates this year contributed to a rebound (+6.0% y/y in 1Q19), but we are likely to see a fade in the near term as pent-up demand is satisfied.
The Pending Home Sales Index, which tends to lead existing home sales, rose 1.1% in May (-0.7% y/y), mixed across regions.
The Chicago Fed National Activity Index rose to -0.05 in the initial estimate for May, vs. -0.48 in April. At -0.17%, the three-month average was consistent with below-trend growth, but stronger than in the three previous months.
The opinions offered by Dr. Brown should be considered a part of your overall decision-making process. For more information about this report – to discuss how this outlook may affect your personal situation and/or to learn how this insight may be incorporated into your investment strategy – please contact your financial advisor or use the convenient Office Locator to find our office(s) nearest you today.
All expressions of opinion reflect the judgment of the Research Department of Raymond James & Associates (RJA) at this date and are subject to change. Information has been obtained from sources considered reliable, but we do not guarantee that the foregoing report is accurate or complete. Other departments of RJA may have information which is not available to the Research Department about companies mentioned in this report. RJA or its affiliates may execute transactions in the securities mentioned in this report which may not be consistent with the report's conclusions. RJA may perform investment banking or other services for, or solicit investment banking business from, any company mentioned in this report. For institutional clients of the European Economic Area (EEA): This document (and any attachments or exhibits hereto) is intended only for EEA Institutional Clients or others to whom it may lawfully be submitted. There is no assurance that any of the trends mentioned will continue in the future. Past performance is not indicative of future results.
Copyright © Raymond James


