
by John Lynch, Chief Investment Strategist, LPL Financial
KEY TAKEAWAYS
- We believe the economic and earnings environment will support the potential for additional gains for stocks over the second half of 2019.
- Better than expected earnings may be a positive stock market catalyst while historical patterns forecast the possibility of more strength through year end.
- We encourage investors to look beyond short-term market stresses and consider the real, fundamental drivers of investment returns.
We expect stocks to move higher over the second half of the year. Stocks already have had quite a run in 2019, buoyed by a return to fundamentals, with the S&P 500 Index up 17.4% year to date through June 28 for an 18.5% total return. The decision by the Federal Reserve (Fed) to pause rate hikes was the catalyst for the reversal, as market participants no longer feared that the Fed might unnecessarily restrict growth. U.S. economic data also have generally supported a continued economic expansion, while businesses continue to find ways to effectively navigate the environment. Generally upbeat first-quarter corporate earnings results gave investors another fundamental reason to bid stocks higher.

Earnings and valuations
The earnings picture changed in May, however, after US.-China trade talks derailed. Due to the increased risk of a prolonged trade war, on June 10 we slightly reduced our S&P 500 earnings per share (EPS) forecast for 2019 from $172.50 to $170, which would represent 5–6% EPS growth if realized. The forecast is still above Wall Street’s consensus of $168, which we suspect is too low considering the mostly positive fundamental environment. Better than expected earnings may be a positive stock market catalyst.
Valuations remain favorable for U.S. stocks. The S&P 500’s forward 12-month price-to-earnings (P/E) ratio is within historical norms, and P/E ratios relative to interest rates and inflation are both well below long-term averages. Given low rates and inflation, we think a trailing 12-month P/E ratio of 17.5 is appropriate. Combining this with our EPS forecast, we believe at year end the S&P 500 would be fairly valued in the range of 3,000, which is about 2% away from the June 28 close.
Historical perspective
Historical patterns also forecast more strength through the end of the year based on stocks’ strong start. The S&P 500 has historically risen an additional 6% over the rest of the year after a first-quarter gain of 10% or more.
Of course, stocks rarely climb in a linear fashion. We warned of a midyear stock pullback as early as March. Our call wasn’t an indictment of weakening fundamentals, but rather a recognition that a period of renewed volatility was increasingly likely after such a strong rally. Historically, when the S&P 500 has gained 10% or more in the first quarter, stocks have endured an average pullback of about 9% before recovering in the next three quarters.
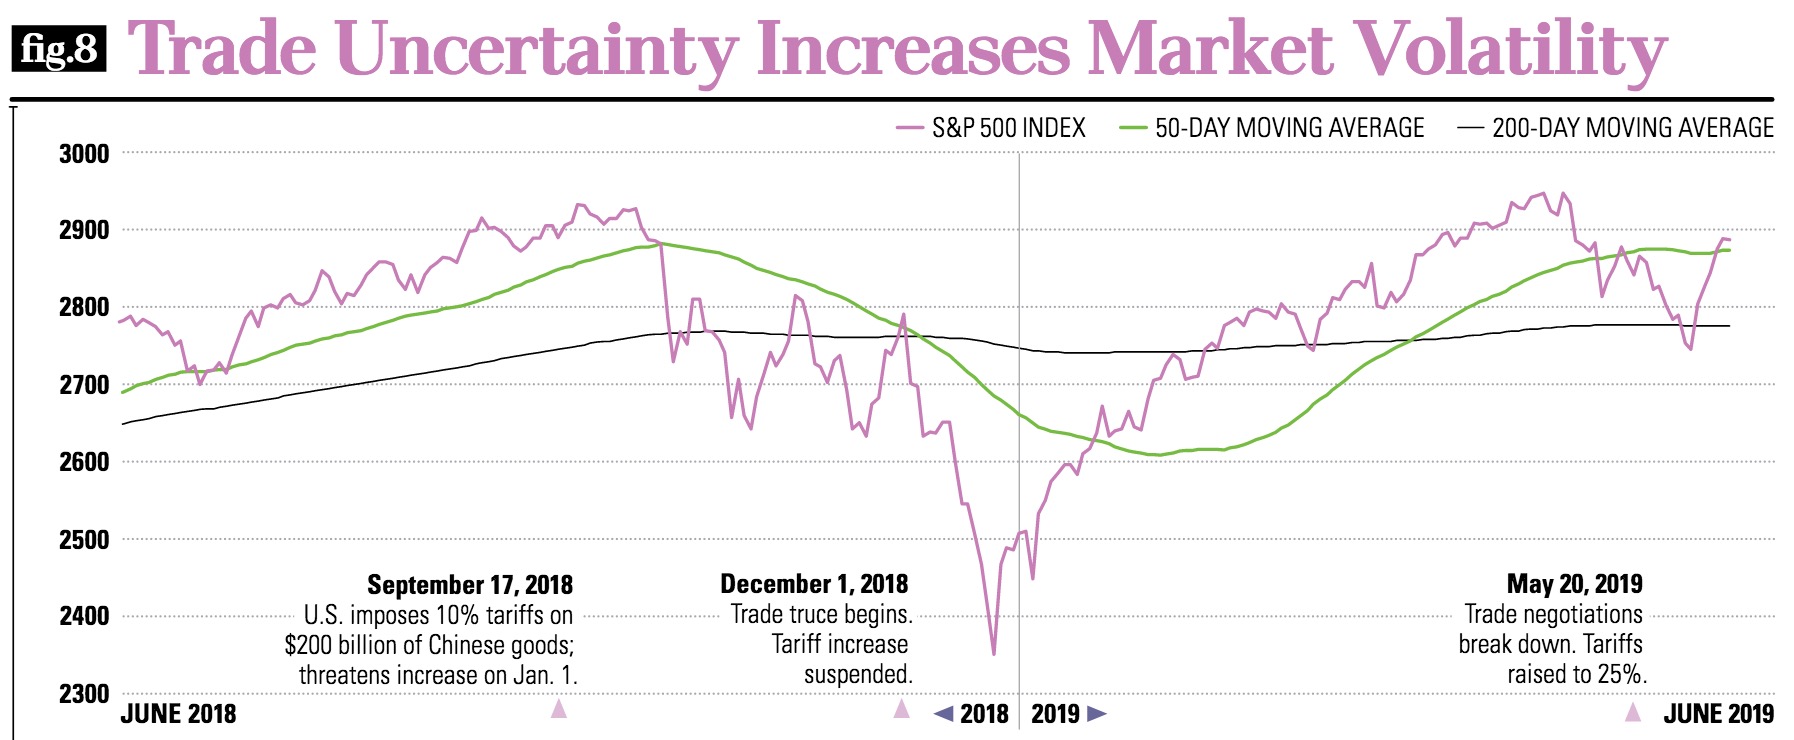
Several market risks are still present, including the geopolitical environment, the possibility of failed trade negotiations (even after the progress made over the weekend), and a potential monetary policy mistake. These risks could fuel periodic bouts of volatility, with trade central to our outlook [Figure 8].
Equities positioning
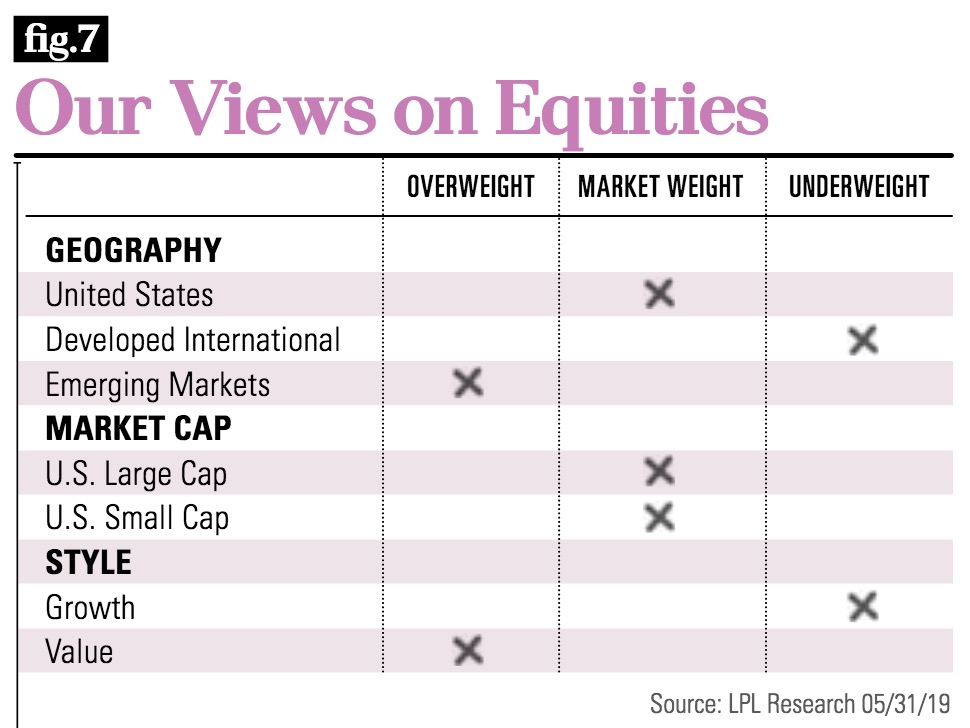
In late March, we went to market weight U.S equities, with a slight preference for large caps over small caps based on valuations, an aging business cycle, and expected improvement in the global trade environment. The beneficiaries of fiscal policies largely comprise the value space, but growth has widened its lead since the Fed paused on rate hikes.
Within equities, active strategies are most likely to benefit from the tailwinds of taxes, regulation, and government spending. To the degree that equity prices are driven by monetary policy and move together, active managers may struggle.
Despite the length of this expansion, our sector positioning remains cyclical, with overweight recommendations in industrials, financials, and technology. Defensive sectors, including utilities and consumer staples, appear expensive with poor growth outlooks.
Our concerns about global policies, economies, and interest rates translate into our preference for emerging markets (EM) stocks over international developed-market stocks. Fiscal deficits, populism, and exhausted monetary policies could weigh on sentiment, spending, and investment throughout Europe, while structural reforms and the looming value-added tax (VAT) increase may pressure sentiment in Japan. Population growth, improved flexibility in production, economic momentum, and valuations all favor EM [Figure 7].
Conclusion
We believe the economic and earnings environment will support additional gains for stocks over the second half of 2019. Steady, albeit slower, economic growth, modest inflationary pressures, our forecast for better than expected corporate profits, reasonable valuations, and our continued belief that U.S.-China trade relations will improve later this year all underpin our positive view of stocks despite such strong gains year to date and lingering risks. The progress made by President Trump and Chinese President Xi at the G20 summit in Japan over the weekend is encouraging but much more work remains.
We are still navigating a challenging environment. Investing comes with uncertainty, and market volatility can be alarming, but we continue to encourage investors to look beyond short-term market stresses and consider the real drivers of investment returns. Our Midyear Outlook 2019 provides our updated views of current fundamentals that we believe can help provide perspective on what really matters in the markets and enable investors to better pursue their long-term financial goals.
*****
IMPORTANT DISCLOSURES
The opinions voiced in this material are for general information only and are not intended to provide specific advice or recommendations for any individual. To determine which investment(s) may be appropriate for you, consult your financial advisor prior to investing. All performance referenced is historical and is no guarantee of future results.
Our recommendations are subject to change at any time based on market and other conditions. Economic forecasts set forth may not develop as predicted, and there can be no guarantee that strategies promoted will be successful.
Investing involves risks including possible loss of principal. No investment strategy or risk management technique can guarantee return or eliminate risk in all market environments.
Because of its narrow focus, specialty sector investing, such as healthcare, financials, or energy, will be subject to greater volatility than investing more broadly across many sectors and companies.
Investing in foreign and emerging markets securities involves special additional risks. These risks include, but are not limited to, currency risk, geopolitical risk, and risk associated with varying accounting standards. Investing in emerging markets may accentuate these risks.
All information is believed to be from reliable sources; however LPL Financial makes no representation as to its completeness or accuracy.
DEFINITIONS
Gross domestic product (GDP) is the monetary value of all the finished goods and services produced within a country's borders in a specific time period, though GDP is usually calculated on an annual basis. It includes all of private and public consumption, government outlays, investments, and exports less imports that occur within a defined territory.
Earnings per share (EPS) is the portion of a company’s profit allocated to each outstanding share of common stock. EPS serves as an indicator of a company’s profitability. Earnings per share is generally considered to be the single most important variable in determining a share’s price. It is also a major component used to calculate the price-to-earnings valuation ratio.
The PE ratio (price-to-earnings ratio) is a measure of the price paid for a share relative to the annual net income or profit earned by the firm per share. It is a financial ratio used for valuation: a higher PE ratio means that investors are paying more for each unit of net income, so the stock is more expensive compared to one with lower PE ratio.
INDEX DESCRIPTIONS
The Standard & Poor’s 500 Index is a capitalization-weighted index of 500 stocks designed to measure performance of the broad domestic economy through changes in the aggregate market value of 500 stocks representing all major industries.
Copyright © LPL Financial