by Kurt Reiman, Blackrock
Why aren’t oil prices reacting to heightened Gulf tensions more strongly? Kurt explains.
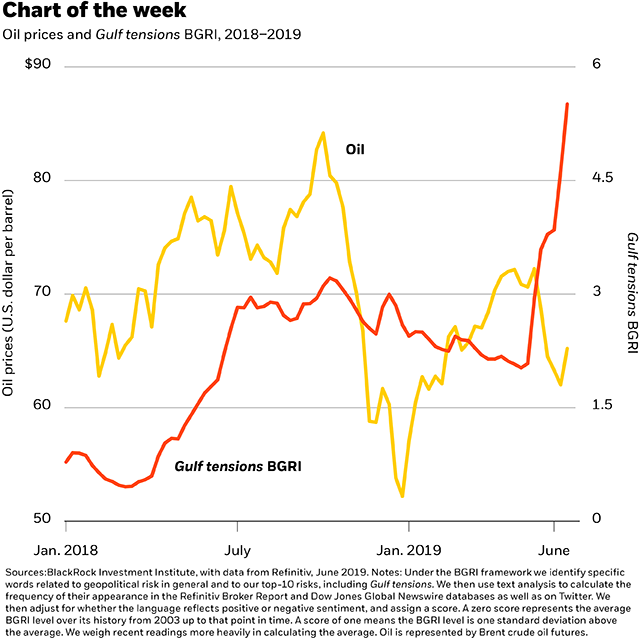
Geopolitical tensions in the Persian Gulf – the world’s key oil exporting region – have risen sharply in recent months. Heightened Gulf tensions historically have tended to drive oil prices up, but this year oil has traded way below its late-2018 peaks, and oil-related stocks have lagged the broader market. What could explain this seemingly odd disconnect? A number of drivers may be behind it: from oil market fundamentals to geopolitics and the global growth outlook.
Gulf tensions have increasingly featured in market chatter since the start of May, when U.S. President Donald Trump imposed new sanctions on Iran and ended waivers for countries to buy Iranian oil. Our BlackRock geopolitical risk indicator (BGRI) on Gulf tensions, which scans and analyzes broker reports, financial press and tweets for keywords related to the risk, has spiked to 5.5 standard deviations above its historical average. The downing of a U.S. drone and a series of attacks on shipping vessels in the Gulf and off the coast of Yemen have increased tensions, and sent oil prices rallying in recent weeks. Yet Brent crude oil prices, an international benchmark, are still down 6% since early May.
A confluence of drivers
What could be holding oil back? Fears of a global downturn – which would hit oil demand – are one reason cited for the muted oil price reaction. The International Energy Agency (IEA) has trimmed the global oil demand outlook for two months straight, citing weakening economic sentiment. Yet we see a limited near-term risk of the usual catalysts that bring economic expansions to an end – financial vulnerabilities leading to a deleveraging, or overheating that prompts central banks to overtighten policy. And we see a dovish pivot by global central banks extending the lifespan of this economic expansion, even as trade disputes have increased macro uncertainty.
The Organization of the Petroleum Exporting Countries (OPEC) members and their allies are expected to roll over the current output cuts at a policy meeting this week, as the market is faced with moderate oversupply. Yet OPEC output curbs can do only so much to prop up oil prices. The U.S. – thanks to the rise in shale production – has become one of the key swing producers alongside the likes of Russia and Saudi Arabia, and is not subject to the OPEC production cuts. Shale producers have historically tended to ramp up production when prices are high, effectively capping oil price gains. This phenomenon may be less prominent today, as even shale producers have come under pressure to curb capital spending and to deliver positive free cash flow. We see these forces likely to keep oil prices in a range, with Brent oil trading between $60 and $70 a barrel in the near term.
What does this mean for investors seeking opportunities in the energy space?
Global energy stocks have risen about 12% year to date, below the nearly 15% performance of the broader market. We still see opportunities, and favor companies with the ability to generate income and withstand late-cycle volatility. One example: integrated oil companies in Europe, for their income-generating ability and capital discipline. Their dividend yields are even more attractive for those investors hedging back into U.S. dollars, thanks to the hefty U.S.-eurozone yield differential. We also like midstream companies (transportation and storage) for their strong free cash flow yields and income potential. We caution against U.S. shale names in the high yield credit space due to few positive catalysts including limited upside in oil prices.
Kurt Reiman is BlackRock’s Chief Investment Strategist for Canada. He is a regular contributor to The Blog
Investing involves risks, including possible loss of principal.
This material is not intended to be relied upon as a forecast, research or investment advice, and is not a recommendation, offer or solicitation to buy or sell any securities or to adopt any investment strategy. The opinions expressed are as of July 2019 and may change as subsequent conditions vary. The information and opinions contained in this post are derived from proprietary and non-proprietary sources deemed by BlackRock to be reliable, are not necessarily all-inclusive and are not guaranteed as to accuracy. As such, no warranty of accuracy or reliability is given and no responsibility arising in any other way for errors and omissions (including responsibility to any person by reason of negligence) is accepted by BlackRock, its officers, employees or agents. This post may contain “forward-looking” information that is not purely historical in nature. Such information may include, among other things, projections and forecasts. There is no guarantee that any forecasts made will come to pass. Reliance upon information in this post is at the sole discretion of the reader. Past performance is no guarantee of future results. Index performance is shown for illustrative purposes only. You cannot invest directly in an index.
©2018 BlackRock, Inc. All rights reserved. BLACKROCK is a registered trademark of BlackRock, Inc., or its subsidiaries in the United States and elsewhere. All other marks are the property of their respective owners.
BIIM0719U-882206-1/1


