by Russ Koesterich, CFA, Blackrock
Continuing the post-crisis trend, U.S. stocks have outperformed the rest of the world this year. Russ explains why.
By most metrics this has been a remarkable year for investors. Stocks are up more than 15%, their best start in decades. Nor is it just stocks. The risk-adjusted return (Sharpe Ratio) on a typical stock/bond portfolio is producing similarly spectacular results. But while the magnitude of year-to-date returns is clearly abnormal, in another sense 2019 resembles the post-crisis norm: U.S. equities are outperforming the rest-of-the-world (ROW).
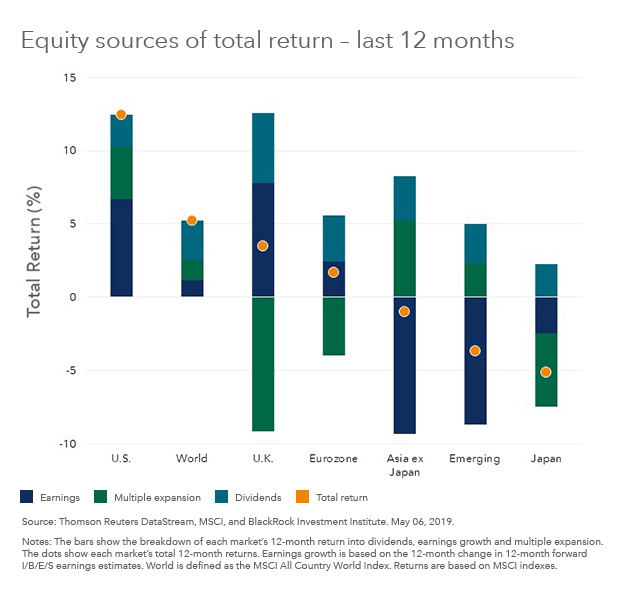
As has been the case in previous years, the out-performance of U.S. stocks over most other markets is being driven by a mix of better earnings growth and relentless multiple expansion (see Chart 1). Since 2010, the S&P 500 Index has outperformed (on a price basis) the MSCI ACWI ex-U.S. Index by an average of 70 basis points (bps) a month, a statistically significant difference.
While investors have become accustomed to this state of affairs, it was not always the case. In the period between 1990 and the end of 2009, the return differential between U.S. and non-U.S. equities was much smaller. During that period the average monthly performance spread was 22 bps, the median, which is less influenced by extreme observation, an even more insignificant 8 bps.
All of this raises the question: Why have U.S. stocks been perennial out-performers since the financial crisis? There are many potential explanations, but one simple one is profitability.
During the “aughts” decade, the average spread in profitability, measured by the return-on equity (ROE) between the S&P 500 Index and the MSCI ACWI-ex-U.S. Index was roughly 1.5%. Not only was the spread relatively narrow, but those years witnessed a prolonged period, leading up to and including the financial crisis, when profitability was higher outside of the United States.
Things have changed post-crisis. Since the beginning of 2010 the average ROE spread between the two indexes has widened to 3.7%. Just as important, since the start of the decade, there has not been a single month when U.S. corporate profitability was below the ROW. Put differently, not only have U.S. companies been significantly more profitable than their non-U.S. counterparts, but excess U.S. profitability has been consistently more reliable in the post-crisis environment.
Faster growth the key
Why this should be the case is not hard to understand. U.S. growth, while below the pre-crisis norm, has been consistently faster than Europe and Japan, particularly when you compare nominal growth, i.e. the rate of growth before adjusting for inflation. Faster growth supports higher operating leverage.
The U.S. is also increasingly home to the world’s marquee companies in technology and communications, companies that tend to be consistently more profitable than the broader market. A quick example illustrates the point. The top three companies in the S&P 500 are Microsoft, Apple and Amazon. Their average ROE is 39%. By contrast, the top three companies in Europe–Total, SAP and LVMH–have an average ROE of 14%. Perhaps it’s not such a mystery why U.S. companies, despite materially higher valuations, continue to outperform.
Russ Koesterich, CFA, is Portfolio Manager for BlackRock’s Global Allocation team and is a regular contributor to The Blog.


