by Liz Ann Sonders, Brad Sorensen, Jeffrey Kleintop, Charles Schwab and Company
Key Points
- U.S. stocks have been fairly resilient in the face of slowing economic growth and rising fears of a recession. Volatility has been subdued, but bouts could reemerge dependent on a few key developments.
- A recession is inevitable at the end of a cycle; it’s just a question of when. Looser financial conditions and a Federal Reserve in pause mode suggest a longer length of runway; however, ongoing trade policy uncertainty could keep business confidence and capital spending from rebounding, thereby shortening the runway.
- Recession risks have also risen in Europe, but that doesn’t necessarily mean that stocks in that region are destined to underperform.
Listen to the latest audio Schwab Market Perspective.
“The sign that something does matter to us is that we lose our steadiness.”
― Adam Phillips
Needed pullback or something more?
There is little doubt that your finances and investments matter to you, but emotional steadiness is essential to long-term success. The market environment can change quickly. Witness the last couple of weeks. Two weeks ago we cautioned against chasing the rally, believing that a pullback could help correct some technically overbought conditions that developed with the rally off the Christmas Eve lows. Fast forward to the first week in March, which was the worst for U.S. stocks so far this year. Volatility surged (before quickly retreating) over growth concerns in the United States and much of the rest of the world. Although not quite to the same degree as what characterized last September’s market highs, attitudinal measures of investor sentiment had rebounded into the extreme optimism zone, reversing slightly during the first week in March. In fact, pessimism as per the American Association of Individual Investors is now at a six-week high. But the fledgling pickup in optimism has not been matched by behavioral measures of sentiment. The latest Commitment of Traders report showed limited buying by the largest cohorts of investors—including large and small speculators and commercial hedgers. We also know from Schwab data that retail fund flows have been anemic; suggesting that much of the juice for the rally has come from corporate stock buybacks, which are running at a record pace on an annualized basis.
We’ve also seen mirror image behavior this year with regard to equity multiples. Last year was characterized by exceptionally strong earnings growth (the E in P/E), but a weak stock market (the P in P/E) and tighter financial conditions—leading to multiple compression. This year, earnings expectations have steadily deteriorated; but thanks to looser financial conditions, multiples have actually expanded. We do believe there is a limit to continued multiple expansion and that earnings growth will likely have to exceed the lowered expectations bar for the market to generate significantly more upside. Consensus estimates for first quarter S&P 500 earnings are now in slight negative territory; with only 3% growth or so expected for the subsequent two quarters. This suggests the risk of an earnings recession is elevated, even if it occurs outside of an economic recession (like was the case from mid-2015 to mid-2016).
State of the economy
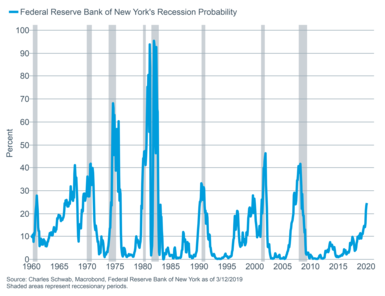
The pause in the rally seen earlier this month can be attributed to economic and earnings growth concerns and growing recession fears. According to The Washington Post, Google searches including the word “recession” recently hit their highest level since the Great Recession. Tied to that is the latest reading from the Atlanta Fed of their GDPNow forecaster, which has plunged to only an annualized 0.4% growth rate. Although the less-well followed Nowcast from the New York Fed is higher at 1.4%; they also have a recession probability model which has continued to tick higher as you can see in the chart. Concurrently, given weak recent readings on the trade deficit and construction spending, last year’s fourth quarter real gross domestic product (GDP) is likely to be revised down from its initial release of 2.6%.
Recession odds have risen
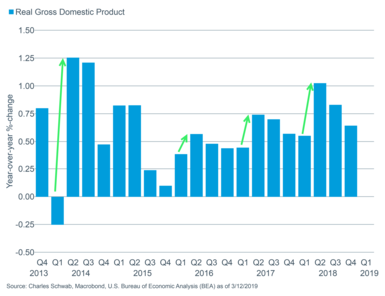
A caveat to the caution expressed in the aforementioned data is that the first quarter of each year tends to bring heightened seasonal adjustment problems; and typically a weak initial, but ultimately revised higher, reading on GDP. As you can see in the chart, the first quarter has been slower than the rest of the year quite consistently; while attempts to correct this anomaly have so far been only marginally successful.
But Q1s are often weaker
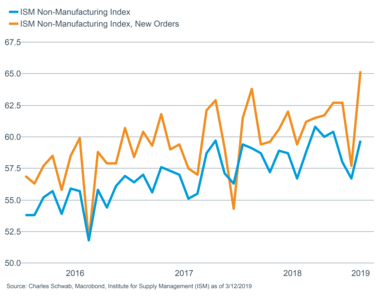
This year’s first quarter has also had some unique (and temporary) influencing factors; including the government shutdown and unusually frigid weather. Some recent economic data has perked up: the Non-Manufacturing Institute for Supply Management (ISM) Index rose to a solid 59.7, while the forward-looking new orders component spiked from 57.7 to a robust 65.2.
And service index indicates future growth
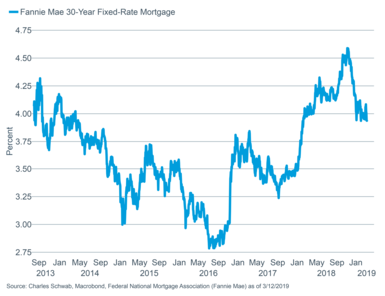
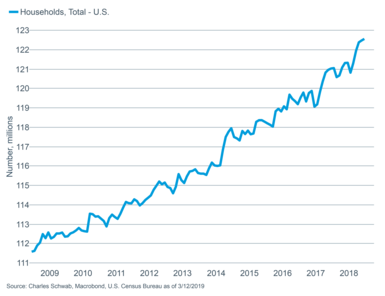
Additionally, housing starts, which saw a steep drop in November, bounced in December; providing some encouragement that housing may not be a drag on growth. We are heading into the spring selling season, mortgage rates have declined and household formations have continued to rise.
Declining rates
And increased formations should help housing
Critically, the labor market continues to be tight; possibly a factor in the weak employment report for February. The Labor Department reported that only 20,000 non-farm payroll jobs were added in February, with the unemployment rate dropping to 3.8%. The anemic payrolls count may be exaggerating the softening of the labor market as other measures remain solid, including the 183,000 jobs gain reported by ADP. The still-healthy labor market, alongside a stronger stock market, likely contributed to a rebound in February’s Consumer Confidence from The Conference Board, which jumped back up to 131.4 from the shutdown-impacted 121.7 in January.
While the consumer continues to look fairly healthy, business optimism remains fairly subdued. For animal spirits, and capital spending, to revive, we believe a resolution to the outstanding trade disputes is needed. Stocks have moved higher in advance of a potential Chinese trade announcement, which points to the risk of a “buy on the rumor, sell on the news” reaction by stocks. We do believe a solid agreement—especially one that addresses China’s most egregious trade practices—could revive confidence in making longer-term investment decisions. Absent a solid agreement, markets may be disappointed in a “light” agreement that only provides loose promises by China to purchase more U.S.-made goods. And even with a more solid agreement; experts per the Wall Street Journal are starting to express reservations about the monitoring and enforcement mechanisms that could be put in place.
Crouching inflation, hidden danger?
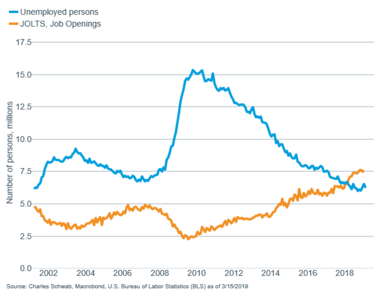
Along with hopes for a trade deal with China, we believe the recent shift of the Federal Reserve to a more dovish stance contributed to the year-to-date rally. But the aforementioned tightness in the labor market, which has led to a continued acceleration in wage growth, could begin to filter into traditional inflation measures—a mild risk we believe is underappreciated by the market. There continue to be more job opening than workers available right now according to the Job Openings and Labor Turnover Survey (JOLTS).
More openings than workers
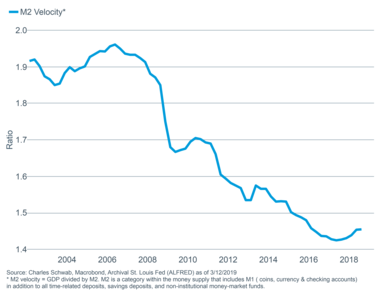
While this is great news for Main Street workers, higher wage growth has implications for corporate profit margins as companies compete for limited workers. The anecdotal stories are piling up, including one highlighted in The Wall Street Journal, about truckers having an increasingly difficult time filling open positions. In addition, as per the National Federation of Independent Business (NFIB) survey, the percentage of small companies seeing the cost of labor as their “single most important problem” recently hit a record high. Adding to the list of possible inflation triggers, the long downturn in the velocity of money, which has contributed to keeping inflation low, appears to be turning back up. It’s too soon to declare a new higher trend, but is on our list of things on which to keep a close eye.
Higher velocity could push inflation higher
We don’t see risk of a significant rise in inflation as there are still ample deflationary forces at play globally; but even a modest increase could cause some consternation for investors, as well as the Fed. (For more on inflation see Liz Ann Sonders’ article Can’t You Hear Me Knocking: A Contrarian Look at Inflation.)
Is Europe already in recession?
As noted, we don’t think inflation in the United States will run away, because there are continued deflationary pressures globally. Last week, the European Central Bank (ECB) lowered its 2019 forecast for Europe’s economic growth and inflation. But is the ECB behind the curve? Has Europe already slipped into a recession? Market-based measures have been pointing to heightened risk of a recession for some time now. German 10-year bond yields have fallen to near zero, signaling a weak outlook. Additionally, stocks in Europe have been tracking a similar pattern to that during the last European recession, which took place from mid-2011 to early-2013.
Yet, despite similar market reactions, the data shows that the economic downturn hasn’t been nearly as deep as in 2011-13. Economic growth still remains positive and running at a quarterly growth rate that is about 0.4% higher (or 1.6% on an annualized quarterly basis) than during the 2011-2013 period. So far, this slowdown doesn’t appear to be a recession.
Eurozone economy continues to grow as it tracks pattern of 2011-13 recession
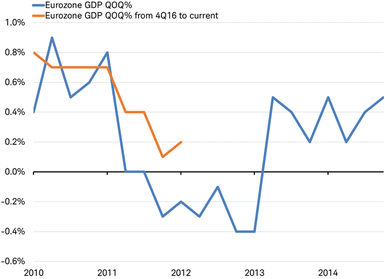
Source: Charles Schwab, Bloomberg data as of 3/10/2019.
It’s not just GDP. Other measures of Europe’s economy also suggest that while growth has slowed, it hasn’t reversed. The widely-watched composite purchasing managers index (PMI) for the Eurozone has certainly slowed from around 58, and has tracked the pattern of 2011-13, but it has not fallen by the same magnitude. The current reading of 51.9 remains above the dividing line of 50 between growth and contraction in the economy. During the 2011-13 recession the PMI was at 46, indicating a recession.
If Europe’s stock market continues to track the pattern of the last European recession, while its economy stabilizes, stocks may be poised for further recovery on a rising but volatile path over the coming year. However, since the current environment seems to be merely a slowdown rather than a recession, the stock market rebound could be a head fake. The real recession may yet come and lead to further market declines.
We continue to see heighted risk of a global recession on the horizon. In addition to keeping close tabs on economic developments and financial conditions, we are watching some key developments that may influence Europe’s economic path:
- Upcoming trade discussions with Europe, involving potential U.S.-led auto-tariffs.
- The impact of leadership changes taking place this year in Europe, including the head of the ECB.
- The United Kingdom’s anticipated “Brexit” from the European Union.
European stocks appear to have already priced in a tougher growth environment, which may leave them better prepared than other markets that are near their all-time highs. There are some encouraging signs of improvement, but there may be more volatility ahead if Europe’s economy fails to stabilize.
So what?
Recession fears have increased but first quarter growth weakness could be short-lived, as has often been the case with first quarters. We don’t see a recession in the near term, but believe trade policy remains a key factor in the span between now and the next recession. Economic and earnings growth risks have risen and the short-lived volatility spike we saw earlier this month could reemerge. Given late-cycle tendencies, we continue to recommend investors remain at or near their longer-term U.S. and global equity allocations, remain diversified, and use volatility for rebalancing opportunities.
Copyright © Charles Schwab and Company


