by Stephen Dover, Executive Vice President, Head of Equities, Franklin Templeton Investments
• A look at what’s driving growth in high-frequency trading
• Why the algorithms behind the trading can lead to bouts of increased market volatility
• The increases in volatility may create opportunities for long-term investors.
Over the past 10 years, the abundance of relatively cheap computing power has led to a rise in the use of algorithms to perform high-frequency trading (HFT). These algorithms often process millions of pieces of data per second and make rapid trades on their own, without human input or oversight. This has transformed the way trades are made and executed.
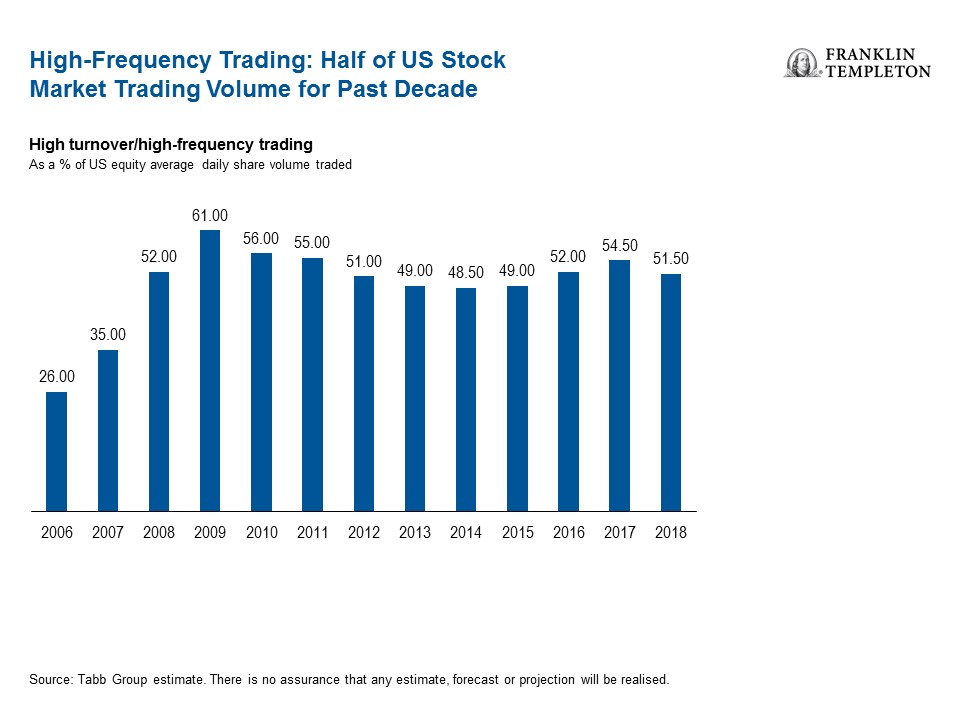
While the pros and cons of HFT algorithms may be debatable, the growth in their use has unequivocally transformed the entire US equity market. HFT has accounted for about half of US stock market trading volume on an annual basis since the global financial crisis (GFC) a decade ago. This explosive growth has led some market commentators to conclude that HFT could contribute to the next market meltdown or at least lead to increased volatility.
 Is High-Frequency Trading Responsible for Market Swings?
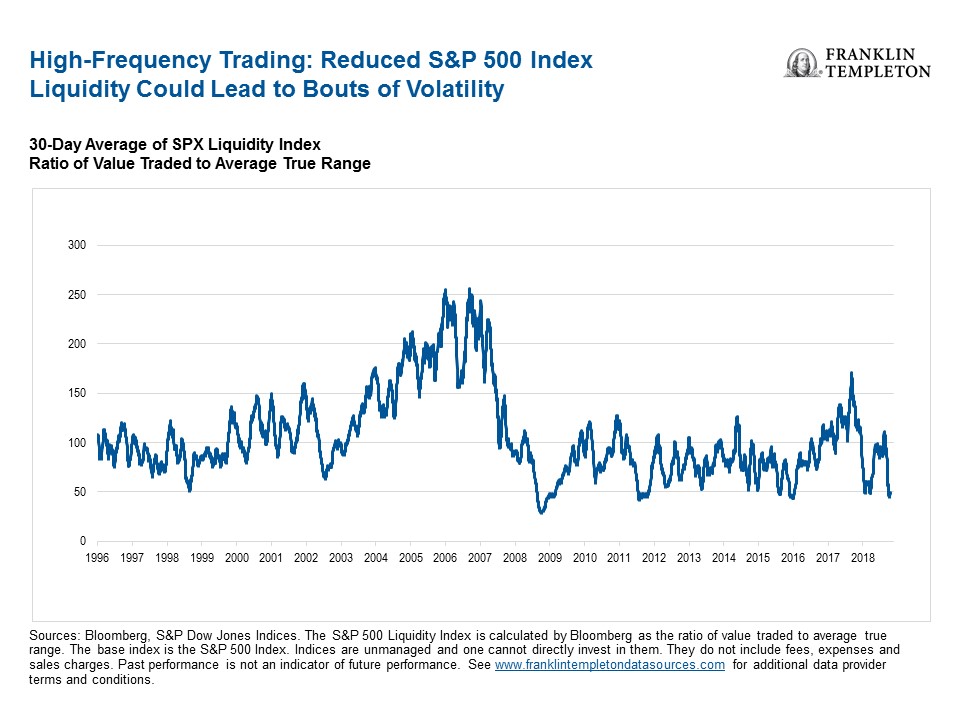
In our view, HFT plays a role in market meltdowns or melt-ups, which could be exacerbated when stocks or markets have low levels of liquidity. The US equity market, as represented by the S&P 500 Liquidity Index, has moved more for each dollar traded in recent years than it did historically. Reduced market liquidity can lead to more volatility, especially if the HFT firms exit a stock or market quickly.
Instances of one-sided trades (more sells than buys or buys than sells) abound when news feeds and market data fluctuate, leading to algorithmic selling/buying across the board irrespective of long-term stock fundamentals.
Unlike many human investors, these algorithms don’t typically consider long-term company fundamentals when making trades, nor do they have emotions, and they will execute when they identify pre-programmed opportunities. They usually trade based on their expectation of how other market participants will react to news feeds and data releases.
Some market commentators have said this disadvantage in processing nuanced fundamental information may lead HFT algorithms to pull back in moments of uncertainty. That, in turn, could trigger surprisingly large drops in liquidity that could exacerbate price declines.
Investment Implications
On days when almost every type of stock sees a severe price correction—from stocks in the tech sector to stocks in what investors normally perceive as safety sectors—it’s often a sign that selling may be approaching an end. According to our analysis, such widespread and intense selloffs tend to signal “capitulation bottoms.”
Some of these one-day meltdowns—like the one seen in December of last year—may not be driven by humans, but rather by HFT. They are often programmed to sell large, liquid exchange-traded funds (ETFs), which sometimes could lead to a “sell-everything” trade as these large, liquid ETFs tend to hold stocks across an entire index.
We think these events can increase the potential for short-term market dislocations but have limited impact on the fundamental value of equities. Equity investors with a long-term view can potentially benefit by buying stocks that look especially cheap when there are “sell-everything” trades.
*****
The comments, opinions and analyses expressed herein are for informational purposes only and should not be considered individual investment advice or recommendations to invest in any security or to adopt any investment strategy. Because market and economic conditions are subject to rapid change, comments, opinions and analyses are rendered as of the date of the posting and may change without notice. The material is not intended as a complete analysis of every material fact regarding any country, region, market, industry, investment or strategy.
Data from third-party sources may have been used in the preparation of this material and Franklin Templeton Investments (“FTI”) has not independently verified, validated or audited such data. FTI accepts no liability whatsoever for any loss arising from use of this information and reliance upon the comments, opinions and analyses in the material is at the sole discretion of the user. Products, services and information may not be available in all jurisdictions and are offered by FTI affiliates and/or their distributors as local laws and regulations permit. Please consult your own professional adviser for further information on availability of products and services in your jurisdiction.
Get more perspectives from Franklin Templeton Investments delivered to your inbox. Subscribe to the Beyond Bulls & Bears blog.
For timely investing tidbits, follow us on Twitter @FTI_Global and on LinkedIn.
CFA® and Chartered Financial Analyst® are trademarks owned by CFA Institute.
Copyright © Franklin Templeton Investments


