by John Lynch, Chief Investment Strategist, LPL Financial, Ryan Detrick, CMT, Senior Market Strategist, LPL Financial
KEY TAKEAWAYS
- Stocks may keep going higher, but the easy gains likely have been made.
- Stock valuations, when compared with bond yields, are actually historically cheap.
- The overall technical backdrop supports a continuation of the bull market.
This week we reassess the stock market landscape following the latest rally. Specifically, we answer five of the most common questions we’ve received recently. We use multiple lenses to assess the stock market, including fundamentals, valuations, and technical analysis.
CAN STOCKS KEEP GOING HIGHER?
Since its low on December 24, 2018, the S&P 500 Index is up 18.8% as of February 22. Gains have been driven by progress in trade negotiations and a shift in the Federal Reserve’s (Fed) communication strategy; however, extreme oversold conditions and low valuations following the worst fourth quarter for stocks since the Great Depression provided an extra boost.
Recent gains eliminated oversold conditions and pushed valuations higher, raising the bar for further gains and making the next leg higher more difficult to achieve. We still see potential for some valuation expansion should the trade dispute be resolved and steady U.S. economic growth continue, but earnings may have to do the heavy lifting to push the S&P 500 to our year-end fair value target of 3000 by December 31, 2019.
IS EARNINGS GROWTH STRONG ENOUGH TO PROPEL STOCKS HIGHER?
We believe stock performance over the rest of the year can at least match the mid-single-digit earnings growth that we expect for the S&P 500 in 2019. A little bit of valuation expansion may help, but we think earnings will be enough to get stocks back to prior highs this year (2930 on the S&P 500) and potentially to our year-end S&P 500 fair value target of 3000.
Though a lot of attention has been paid to cuts in 2019 earnings estimates due to tariffs and slower global economic growth, the U.S. economic backdrop remains solid, manufacturing activity continues to expand (based on the latest Institute for Supply Management [ISM] survey), and the consumer spending outlook is well supported by a healthy labor market.
Tariffs are the primary risk to earnings. Other risks include possible margin pressures from higher wages or another potential leg down for European economies.
HAVE STOCKS GOTTEN TOO EXPENSIVE?
We don’t think so. With the S&P 500 at a forward price-to-earnings ratio of about 16, valuations are roughly in line with the average over the past few decades. Factor in still-low interest rates and inflation, which increase equities’ attractiveness versus other asset classes like fixed income, and we would argue stocks are still attractively valued and modest valuation expansion this year is likely.
An easy way to make this point is to compare the earnings generated by stocks with bond yields, which are essentially earnings generated by bonds. We do this by comparing the earnings yield for the S&P 500 Index (S&P 500 earnings per share divided by the index price level) with the yield on the 10-year Treasury.
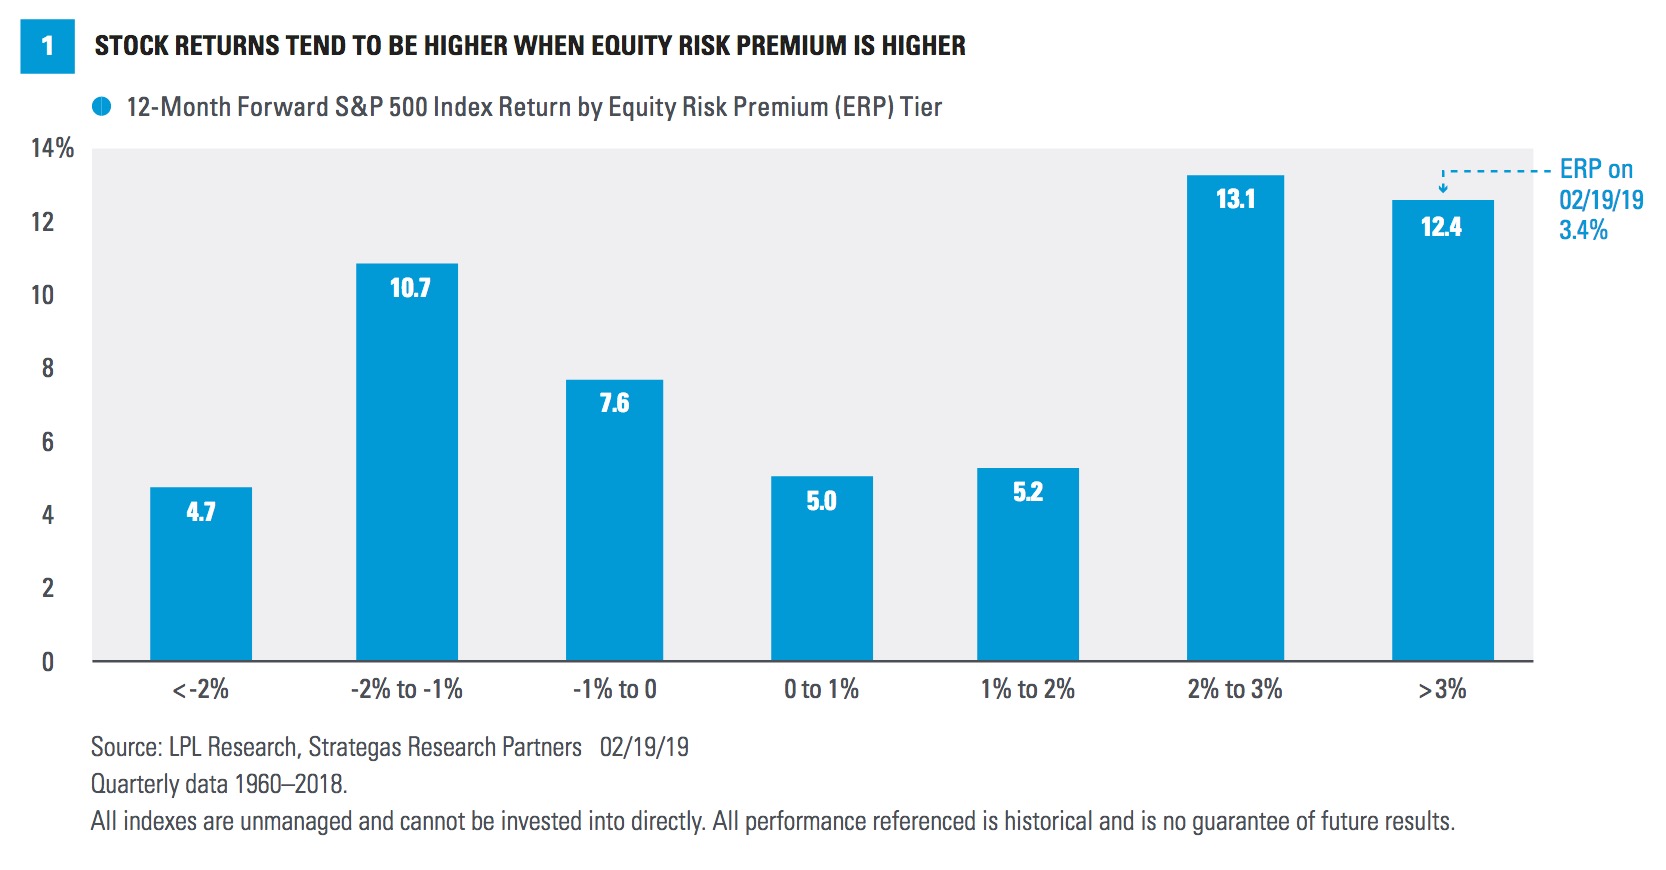
This statistic, referred to as the equity risk premium (ERP), is currently over 3% after averaging about 0.5% over the past six decades. Historically, a higher ERP has pointed to better future stock market performance. Since 1960, when the gap between the earnings yield and 10-year Treasury yield has been above 3% (as it is now), the S&P 500 has gained 12.4% on average over the following 12 months [Figure 1].
DO WE NEED A RETEST?
We believe a retest of the December 24, 2018, low for the S&P 500, near 2350, is unlikely. As we wrote here last week, with more than 70% of S&P 500 components recently hitting 20-day highs, we believe pullbacks in the near term will be modest.
Market breadth, which measures how many stocks are participating in the movement of broader indexes, is another positive sign. The NYSE Common Stock Only Advance/Decline line recently broke out to new all-time highs. We’ve seen time and time again that new highs in market breadth has led to eventual new highs in price.
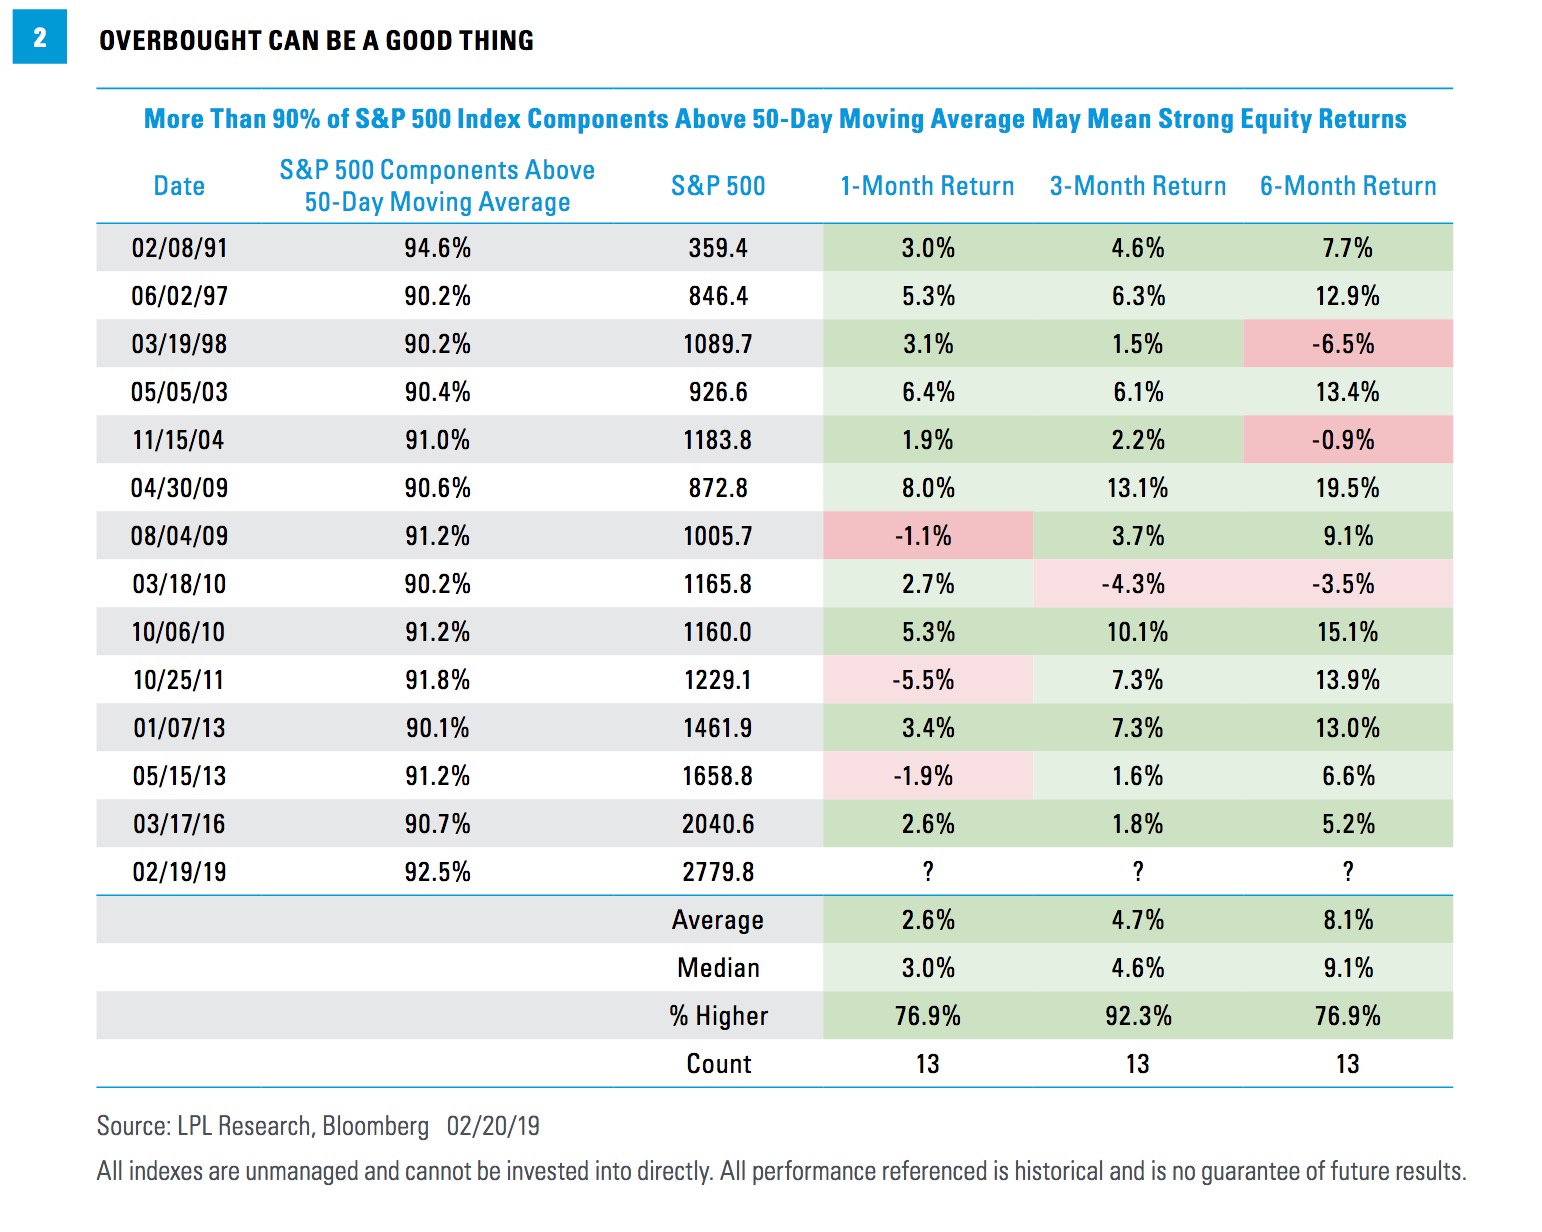
Lastly, more than 90% of the components in the S&P 500 recently were trading above their 50-day moving average. While it may seem like stocks are overbought based on this metric, as Figure 2 shows, being overbought by this measure is actually quite bullish.
IS SENTIMENT NOW OVERLY BULLISH?
We don’t think so. As discussed last week, the overall technical backdrop continues to look strong, but one other substantial positive is that investor sentiment is still not near levels of optimism that we would consider to be a major warning sign. We use several surveys to gauge sentiment, including the AAII bull-bear survey and the CNN Money Fear and Greed Index, as well as investor flows.
History has shown that the crowd can actually be right during trends, but it also tends to be wrong at extremes. This is why sentiment can be an important contrarian indicator. If everyone who might become bearish has already sold, only buyers are left. The reverse also applies. We see this contained optimism as healthy and, in fact, are surprised there isn’t more excitement after such a powerful rally.
CONCLUSION
The questions are mounting after the significant gains since the December 24 lows. The good news is that our expectation for steady earnings growth, solid technicals, and nice valuations amid a healthy economic backdrop support further gains for stocks throughout 2019. We reiterate our year-end fair value range of 3000 for the S&P 500 from our Outlook 2019 publication.


