
Equity markets in North America and Asia Pacific have resumed their upward course this week after spending the first part of February digesting their January recovery rallies. The breadth of the current advance remains impressive, not only geographically but in terms of scope with investors returning to historically more volatile areas like commodities and emerging markets.
We’re nearly at the end of earnings season but in the coming days, reports from Canadian banks and US retailers may dominate the headlines. US-China and Brexit talks may influence trading action in the coming days with deadlines approaching, although these could be extended.
One of the factors underpinning the current market recovery has been speculation that the Fed may slow or pause it’s rate hike program. On Friday the Fed is releasing a Monetary Policy report and five FOMC members are scheduled to speak so we may get a better idea of what the Fed is thinking heading toward the March meeting which could continue or end the recent program of quarterly rate hikes.
One thing to keep an eye on in the coming days is the potential for distortions in US economic data for December and January related to the US government shutdown. Not only did the shutdown impact the economy temporarily, but many of the government employees who collect the data were impacted.
In the last week, an unusually weak US retail sales report was quickly discounted by investors and then repudiated by strong earnings from Wal-Mart. Still investors should note not to read too much into the odd surprise here or there.
In this issue of Equity Leaders Weekly, we look what the current rally in Dr. Copper tells us about expectations related to trade, China, emerging markets and metal stocks. We also look at the NASDAQ Biotechnology Index as an example of capital returning to risk markets.
High Grade Copper Continuous Contract (HG.F)
Copper has long been considered to be the commodity most sensitive to global economic conditions. Since the turn of the century, it has also been one of the commodities most sensitive to Chinese demand for resources.
As trade tensions between the US and China intensified in 2018 and investors feared that a full-blown trade war could slow the global economy and cut into resource demand, the price of copper plunged. Back in January, Copper successfully retested its August 2018 low near $2.55/lb and since then, has been steadily recovering. With China moving to stimulate its economy and US-China trade talks progressing fears of a global recession have faded and metal demand expectations have rebounded.
Bullish technical signals have started to come out of the copper market. First the price cleared $2.81/lb to snap a downtrend line, then it broke through $2.87 to complete a bullish Spread Double Top pattern and confirm the start of a new uptrend. Next potential resistance appears at prior lows near $2.96 then $3.05, followed by $3.17 based on a horizontal count. Initial support appears near $2.76.

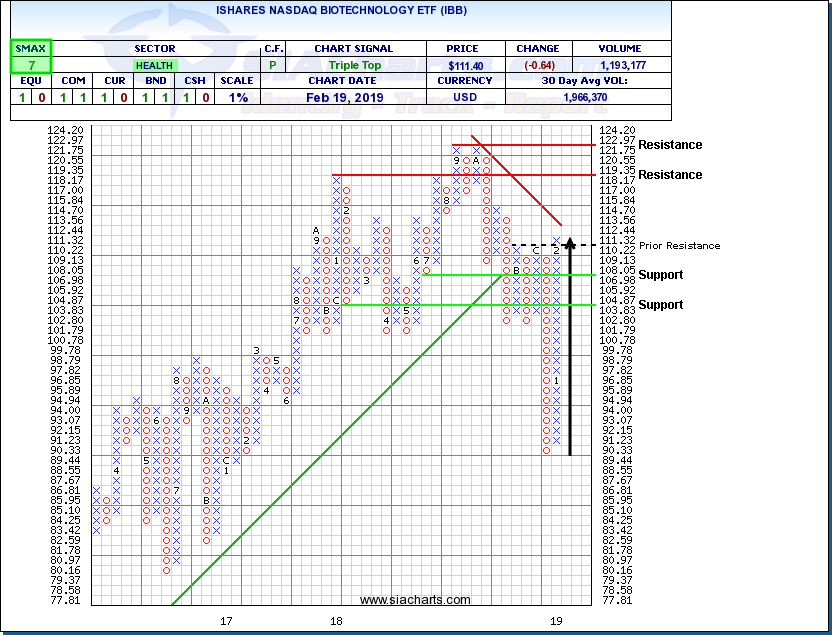
iShares NASDAQ Biotechnology ETF (IBB)
As an area featuring a number of development stage products, regulatory approval risk, political questions over pricing and emerging companies, Biotechnology has historically been one of the more volatile areas of the Health Care sector, sometimes acting more like a Technology group.
Because of this history, Biotechnology sector action can provide a barometer of investor attitudes toward risk over time. As investor sentiment turned from euphoria to caution to panic over the last three months of 2018, the iShares NASDAQ Biotechnology ETF (IBB) was crushed, falling 27.6% peak to trough, worse than the approximate 20% decline of the S&P 500.
As investor confidence has returned, IBB has roared back to life, rallying from near $89.00 toward $111.00 a 25% recovery gain and a sign that investors have returned to risk markets. The recent breakout over $111.32 completed a bullish Triple Top pattern and confirmed the start of a new uptrend. Next potential resistance appears near $119.35 and $122.97 based on previous highs with support climbing toward $106.98.
SIACharts.com specifically represents that it does not give investment advice or advocate the purchase or sale of any security or investment. None of the information contained in this website or document constitutes an offer to sell or the solicitation of an offer to buy any security or other investment or an offer to provide investment services of any kind. Neither SIACharts.com (FundCharts Inc.) nor its third party content providers shall be liable for any errors, inaccuracies or delays in content, or for any actions taken in reliance thereon.