by Jeffrey Saut, Chief Investment Strategist, Raymond James
“ . . . A man has rigged up a turkey trap with a trail of corn leading into a big box with a hinged door. The man holds a long piece of twine connected to the door that he can use to pull the door shut once enough turkeys have wandered into the box. However, once he shuts the door, he can’t open it again without going back into the box, which would scare away any turkeys lurking on the outside. One day he had a dozen turkeys in his box. Then one walked out, leaving eleven. ‘I should have pulled the string when there were twelve inside,’ he thought, ‘but maybe if I wait, he will walk back in.’ While he was waiting for his twelfth turkey to return, two more turkeys walked out. ‘I should have been satisfied with the eleven,’ he thought. ‘If just one of them walks back, I will pull the string.’ While he was waiting, three more turkeys walked out. Eventually, he was left empty-handed. His problem was that he couldn’t give up the idea that some of the original turkeys would return . . . ”
. . . Why You Win or Lose, by Fred C. Kelly
I have used the aforementioned Fred Kelly quote off and on for nearly five decades, but I dredged it up again this morning since over the past five months I have received numerous voice mails/emails with the statement, “I should have!” To wit, “I should have raised cash on the October 2 trader’s “sell signal.” “I should have” bought the massive three session “selling climax” lows that ended on Christmas Eve in one of the most oversold readings I have seen in years. Since then the stock market rally has been legendary. The Dow Wow has lifted the senior index some 19%+ from its intraday low into last Friday’s intraday high. Of course the obligatory question following “I should have” is “what should I do now?”
Well to that point, many pundits continue to suggest that we will get a retest of the Christmas lows of 2346 basis the S&P 500 (SPX/2775.60). However, there are many instances where a major low was never retested. The December 1974, October 1975, March 1978, November 1979 lows were never retested and I could name many more. More recently, the March 2009 lows were NEVER retested. Yet the negative nabobs keep insisting the December 2018 lows will get retested. Someone sent us this over the weekend:
"Several weeks ago we did some research to find out what a typical rally looks like after a big waterfall-like decline takes place. The takeaway was that the rallies after those waterfall declines have lasted anywhere from 1 to 74 days and have retraced 20-90+% of the initial decline. That’s quite a wide range in both duration and magnitude of the move, but a universal similarity was that in 19 of 19 post-war instances of a 15% uninterrupted decline (excluding the current one), the stock market ended up testing the waterfall low in some fashion. That is a pretty compelling statistic that flies in the face of what we are currently witnessing."
The writer goes on to document that statement, but in my opinion uses the wrong dates to make his point. For example, he uses the September 1974 low of 584.56 on the D-J Industrials, but the actual low came in December 1974 at 577.60 and was never retested. Nonetheless, I remain pretty convinced that barring some kind of terrible “black swan” news, the December 2018 lows will not be retested.
As for last week’s stock market, the SPX’s straight-up move left that index higher by 2.5% for the week and in the process eclipsed its 200-day moving average at 2744.88. Not to be outdone the Industrials (INDU/25883.25) rallied 3.1% and likewise closed decisively above their 200-DMA of 25035.68. Those 200-DMAs should now act as a support level. Interestingly, the Volatility Index (VIX/14.91) also tagged its 200-DMA of 16.51 last week, but failed to better it. However, it is worth watching the VIX for if it closes above the 200-DMA the performance by the SPX has been decent (Chart 1). Meanwhile, the S&P 500’s Advance-Decline Line continues to trade toward new highs (Chart 2), but the rally off the December lows has left most industries/indexes very overbought on a near-term basis (Chart 3). Given the stock strength one would think the economic backdrop would be pretty good, but that is just not the case. Take last week, the economic reports were either bad or terrible (industrial production, December retail sales, etc.). This caused the Citi Economic Surprise Index to record its biggest one day drop since January 2016. However, I am not paying much attention to the recent economic statistics because of the government shutdown.
To me, the recent stock market action looks like an upside “blow off” trading top. According to Investopedia:
"A blow-off top is a chart pattern that indicates a steep and rapid increase in a security’s price and trading volume followed by a steep and rapid drop in price and volume. The rapid changes indicated by a blow-off top, also called a blow-off move or exhaustion move, can be the result of actual news or pure speculation."
The call for this week: Even though this feels like a “blow off trading top” I still do not think the December lows will be retested. The invaluable Lowry Research Organization agrees as they wrote over the weekend (as paraphrased):
Lowry identified nine instances since 1940 when their Short Term Index expanded this well from an oversold condition as it has since the December 2018 low. Seven occurred when the S&P 500 was below its 200-DMA and were roughly coincident with a new trend buy signal. The S&P 500 on average rallied some 35% over the next 12 months and 55% over the next two years.
This morning the preopening futures are flat as U.S. China trade talks make little progress. Yet, President Trump apparently decided that he had to spin the negative trade negotiation reports that appeared during Asian trading into something positive. DJT said the U.S. and China talks are going well; the parties are ‘a lot closer’ to making a trade deal and he might extend the March 1 deadline and hinted at an extension of the talks. Despite Friday’s Fling, there was a very negative NYSE breadth divergence which appeared during the final two hours of trading. It feels like a blow off trading top to me.
Chart 1
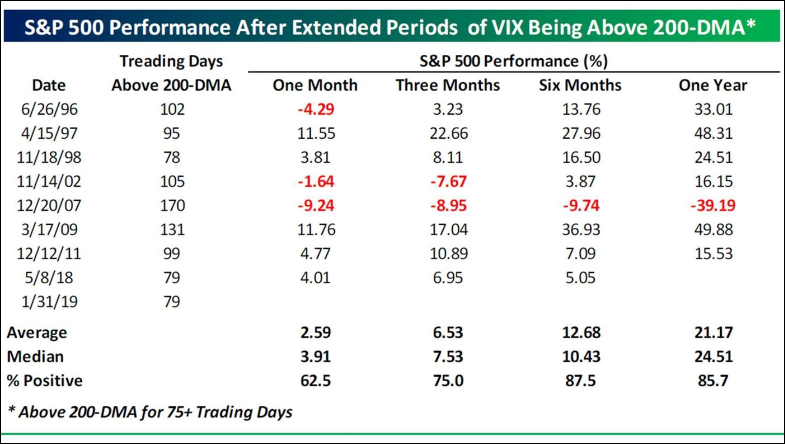
Source: Bespoke Investment Group
Chart 2
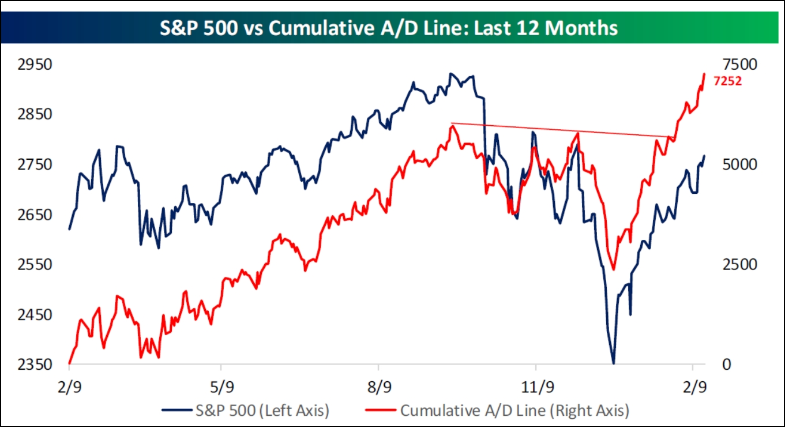
Source: Bespoke Investment Group
Chart 3

Source: Bespoke Investment Group
Additional information is available on request. This document may not be reprinted without permission.
Raymond James & Associates may make a market in stocks mentioned in this report and may have managed/co-managed a public/follow-on offering of these shares or otherwise provided investment banking services to companies mentioned in this report in the past three years.
RJ&A or its officers, employees, or affiliates may 1) currently own shares, options, rights or warrants and/or 2) execute transactions in the securities mentioned in this report that may or may not be consistent with this report’s conclusions.
The opinions offered by Mr. Saut should be considered a part of your overall decision-making process. For more information about this report – to discuss how this outlook may affect your personal situation and/or to learn how this insight may be incorporated into your investment strategy – please contact your Raymond James Financial Advisor.
All expressions of opinion reflect the judgment of the Equity Research Department of Raymond James & Associates at this time and are subject to change. Information has been obtained from sources considered reliable, but we do not guarantee that the material presented is accurate or that it provides a complete description of the securities, markets or developments mentioned. Other Raymond James departments may have information that is not available to the Equity Research Department about companies mentioned. We may, from time to time, have a position in the securities mentioned and may execute transactions that may not be consistent with this presentation’s conclusions. We may perform investment banking or other services for, or solicit investment banking business from, any company mentioned. Investments mentioned are subject to availability and market conditions. All yields represent past performance and may not be indicative of future results. Raymond James & Associates, Raymond James Financial Services and Raymond James Ltd. are wholly-owned subsidiaries of Raymond James Financial.
International securities involve additional risks such as currency fluctuations, differing financial accounting standards, and possible political and economic instability. These risks are greater in emerging markets.
Investors should consider the investment objectives, risks, and charges and expenses of mutual funds carefully before investing. The prospectus contains this and other information about mutual funds. The prospectus is available from your financial advisor and should be read carefully before investing.
Copyright © Raymond James