As we move deeper into 2019, the increasing strength and breadth of the current stock market rebound is becoming increasingly clear. Through January, the recovery in US markets took centre stage, particularly as big cap global US companies were first out of the gate with earnings reports.
Moving into February, it’s becoming increasingly apparent that we are entering a broader, global stock market recovery with indices outside of the US and outside of North America gaining in relative strength. This can be particularly seen in several changes to the SIA Charts Asset Class rankings. International Equity has moved up two spots to second place while Canadian Equity moved up one place to fourth spot. With investors regaining confidence and capital returning to equity markets, defensive asset classes like Cash and Bonds dropped in the rankings.
Looking forward, we’re now moving into the second phase of earnings season where we see a larger number of reports from smaller companies. In this phase, reports may still impact individual stocks and sectors but these reports are less likely to impact broader indices except in aggregate.
Political issues continue to swirl around the markets but investors still remain concerned mostly about US-China trade talks, although ongoing Brexit uncertainty may have some impact on European trading.
In this issue of Equity Leaders Weekly, we highlight the recent strength in some of the largest emerging markets; Brazil, Russia, India and China (BRIC). We also look at a resurgence in the semiconductor sector.
Invesco BRIC ETF (EEB)
Although uncertainty over how the ongoing Brexit debacle may play out has been keeping European in the doldrums relative to other regions, Asia Pacific and Latin American emerging markets have been attracting renewed interest. Part of this may be related to a broad-based rebound in commodity prices including oil, lumber, copper and grains, but it can also be seen as a sign that investors have become more aggressive and willing to jump back into risk markets.
Signs of progress in US-China trade talks have been helping sentiment toward emerging markets and resource markets, but the ups and downs of negotiations could spark action and volatility in either direction over the coming week.
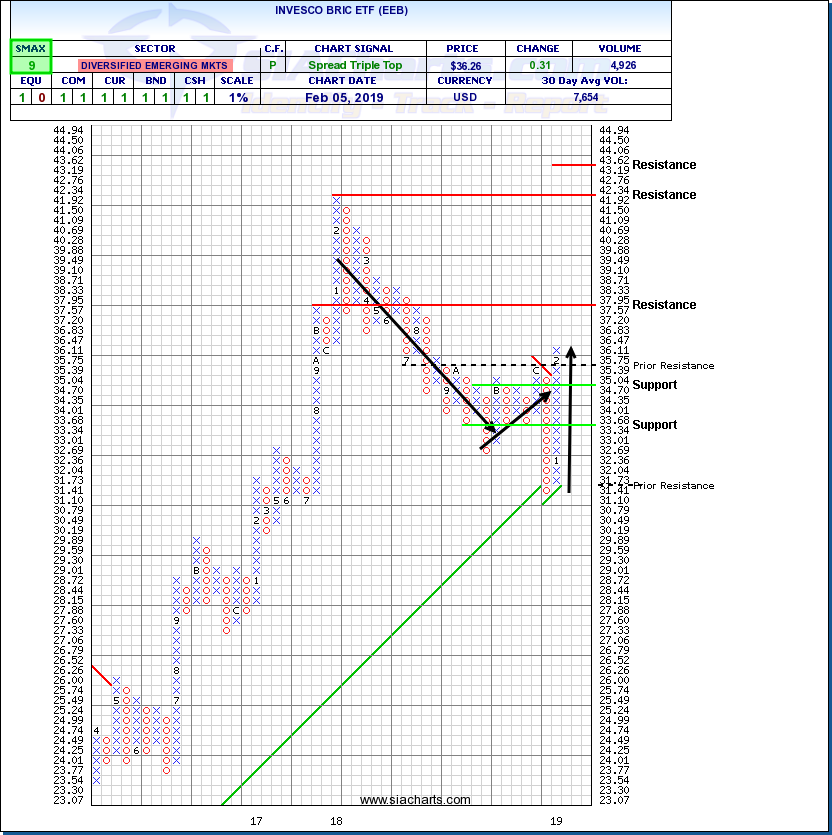
One of the ways that broad-based renewed interest in emerging markets is by looking at the Big 4 emerging market countries; Brazil, Russia, India and China (BRIC). The Invesco BRIC ETF (EEB) shows that BRIC stocks rallied between June of 2016 and February of 2018. The group then trended generally lower through the rest of 2018 but have turned back upward since a final washout in December was completed.
Most significantly, BRIC markets did not participate in the US Summer 2018 rally which eventually failed, but they have joined US markets in their 2019 recovery, a sign that the current upturn has wider breadth and may be more sustainable.
EEB recently broke out over $35.75, completing a bullish Spread Triple Top pattern and confirming the start of a new uptrend. Next potential could appear near $37.95 or $42.35 the tops of previous polies, or $43.60 based on a horizontal count from the Spread Triple Top base. With US-China trade talks ongoing there remains a risk of bumps in the road. In a pullback situation, initial support could appear near $34.70 based on a 3-box reversal. With a bullish SMAX score of 9, EEB is exhibiting strength against the asset classes.
iShares PHLX Semiconductor ETF (SOXX)
Although we have seen a few high-profile profit warnings and nosedives from selected technology stocks like Apple and Nvidia, in recent weeks, overall, sentiment toward the high-beta technology sector has improved significantly this year and technology stocks have been a significant factor behind the speedy market recovery.
Propelled by gains in chipmakers like Xilinx, Advanced Micro Devices, Broadcom and Analog Devices, the semiconductor sector has resumed a long-term uptrend that had paused in 2018, recovering ground lost in an autumn selloff.
The iShares PHLX Semiconductor ETF (SOXX) recently broke out over $174.90, completing a bullish Spread Triple Top base pattern and signalling the start of a new advance. Next potential upside resistance may appear near $187.50 then their previous peak near $195.00 and the $200.00 round number. Initial support moves up toward $168.00 based on a previous low from $163.10. With a bullish SMAX score of 6, SOXX is exhibiting strength relative to the asset classes.
SIACharts.com specifically represents that it does not give investment advice or advocate the purchase or sale of any security or investment. None of the information contained in this website or document constitutes an offer to sell or the solicitation of an offer to buy any security or other investment or an offer to provide investment services of any kind. Neither SIACharts.com (FundCharts Inc.) nor its third party content providers shall be liable for any errors, inaccuracies or delays in content, or for any actions taken in reliance thereon.


