by Jeffrey Saut, Chief Investment Strategist, Raymond James
“I know you ‘warned’ that you’d be too busy this week to pen your daily musings, but that doesn’t mean you’re not missed! (especially when 2713 on the S&P is making it harder to wait for the pullback—let alone a full retest, as others still opine—to reinvest the partial (I stress ‘partial’) cash recently raised). Safe travels . . . oh, and is there a print that would switch the near term bullish view back on or is the available energy even lower now and still needing to be recharged?"
. . . A Raymond James financial advisor
So, I need to apologize to everyone for not being able to do a verbal recorded call last week, or write a missive the last three sessions of the week. The problem was that while in NYC my media events began around 6:00 a.m., followed by more media events, then it was portfolio manager meetings. From there, it was gigs for our financial advisors and their clients with a dinner getting me back to the hotel around 10:30 p.m. In my 50s I could sit down at that time and write for the next few hours, but at 70 I just can no longer do it.
As for the few hate mails I have received suggesting that I didn’t write because the S&P 500 (SPX/2706.53) has overrun my 2600 – 2650 trading target from the December low that we identified, that is pure nonsense since I have repeatedly noted in these missives when I was wrong and this is one of those times. That said, I have been adamant that there would be no retest of the December lows.
The three-session selling squall ended with a selling climax on December 24. Then over the next two weeks there were two 90% upside days, meaning 90% of the total up/down volume came on the upside. In the 80-year history of the Lowry’s organization in almost all of the time that sequence suggests a major stock market bottom has been achieved.
Meanwhile, as the uber-smart Jason Goepfert writes:
- "Record flow. Comprehensive data on mutual fund flows confirm that the massive loss in December for equity funds was the largest on record.
- Back to disbelief. After more than two years of expecting stocks to rally, U.S. consumers have become pessimistic. This has ended a streak of 25 months with more consumes expecting stocks to rally than to decline.
- Mom and pop aren’t buying. After a 5-week rally in stocks, bulls still make up less than 40% of respondents in the AAII sentiment survey."
Despite these factors, the leap in stock prices has left the overall stock market pretty overbought on a short-term trading basis. But as one Wall Street wag notes, “The stock market can stay overbought longer than you can stay solvent!” Interestingly, by my work the stock market’s internal energy has been rebuilt even in light of the recent upside strength, which is a rare occurrence. This implies that the S&P 500 could continue to stagger higher into the often mentioned energy peak in mid-February. Do I trust it? Not really, but in this business you have to take what the markets give you.
Speaking to the January Barometer, about which I have received so many emails asking for comment. Last week my friends at CNBC wrote:
"Best January since 1997 bodes well for the rest of the year . . . at least statistically. This trend is known as the January Barometer, a term coined in 1972. Between 1950 and 2017, the barometer has been correct 58 of 67 times, or approximately 87 percent, according to the Stock Trader's Almanac. The S&P 500 rose 5.62 percent last month, marking its best January performance since 1997."
The notable Wall Street axiom is, “So goes January, so goes the year!” We, however, put much more stock in the “December Low indicator” than the January Barometer. Our dear departed friend Lucien Hooper told us about said indictor over lunch at Harry’s at the Amex bar and grill, admonishing us, “Watch the December closing low for the D-J Industrials. If that low is violated in the first quarter of the New Year, watch out.” Clearly that was the case last year when in early February the December low was taken out; and, we should have paid more attention to that sign. Still, given this year’s January Barometer metrics, combined with our sense that there is no way the December low gets retested, it bodes well for stock returns for the year. That is actually the message we have repeatedly written about despite all the negative nabobs chanting recession, depression, stock market crash, etc.
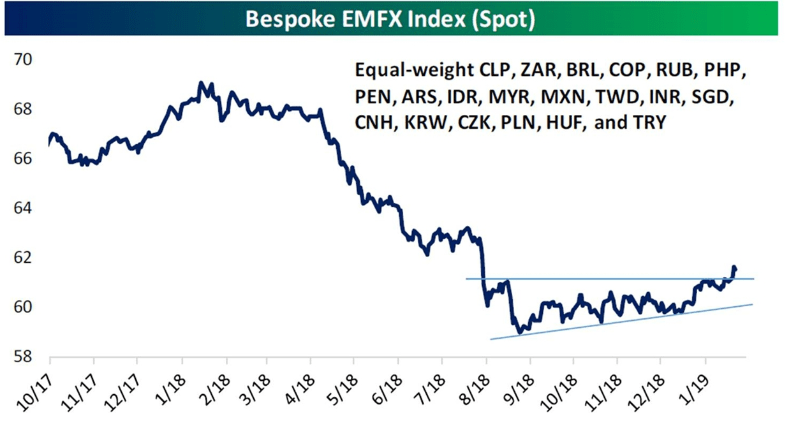
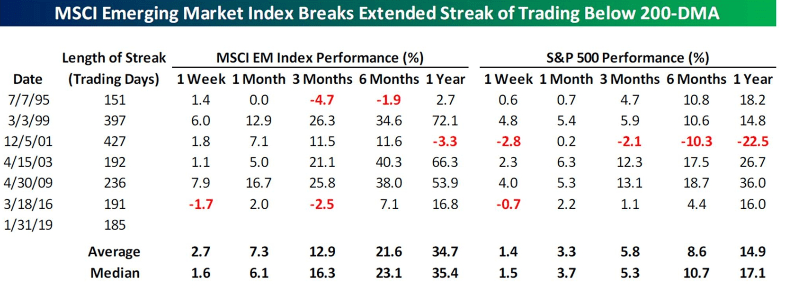
Obviously, last week’s win was attributable to the walk back by the Fed on interest rates, better economic statistics, and continuing good earnings. The Fed’s softer stance has caused the U.S. dollar to weaken and allowed the emerging markets to break out to a new five-month high (chart 1 on page 3). It was one of the longest stretches below its 200-day moving average in a long time at 185 sessions. For the MSCI Emerging Markets Index it was the longest since 2016 and the sixth longest on record and just the seventh time longer than 150 trading days. The performance following such a skein can be seen in chart 2.
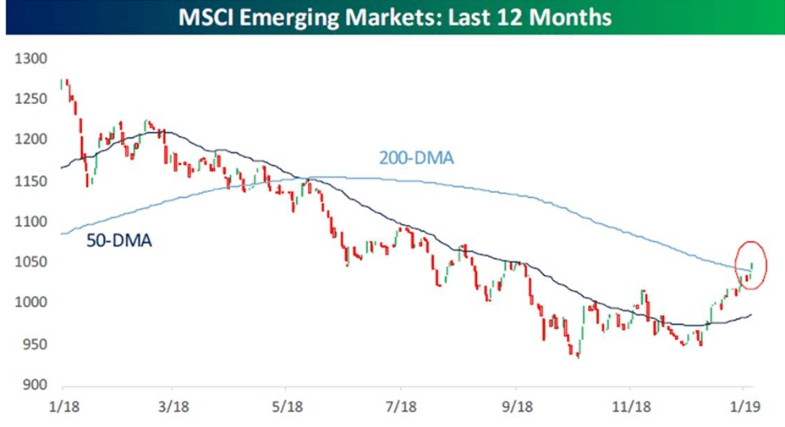
That performance is reflected in the MSCI Emerging Market Index, which is up some 10% year-to-date (chart 3 on page 4). In the process that index has finally closed above its 200-day moving average for the first time since May 2016. One of my themes has been to buy emerging markets because they are “cheap,” but your time horizon has to be three+ years. I would use actively managed mutual funds to play to this theme.
According to Bespoke:
"Many of next week’s releases are November data points that had been postponed due to the government shutdown.
- On Monday, we will get November data for Factory, Durable Goods, and Capital Goods Orders and Shipments which are all forecasted to come in stronger than the prior print.
- Tuesday will follow those releases up with the services component of global Markit PMIs.
- The ISM Non-Manufacturing index is set to come out not long after.
- On Wednesday, the Treasury will release trade balance data for November which is expected to come in at a slightly smaller deficit.
- Also coming out Wednesday morning is preliminary productivity and labor cost data for Q4.
- While Nonfarm Productivity is expected to drop by 0.6% QoQ, labor costs are looking to rise considerably.
- While there are no releases scheduled for Friday, Consumer Credit on Thursday will look to close out the week."
The call for this week: Despite the overbought condition, my work suggests the equity markets can trade higher into the mid-February energy peak often referenced in these reports. Despite that outlook, I do not trust the overbought condition the equity markets have currently worked themselves into and continue to advise for caution on a short-term trading basis. That said, there is now plenty of internal energy in the equity markets to continue the move higher, even though the SPX has overrun my initial trading target of 2600 – 2650. I was right at the December lows, but have been wrong on the 2600 – 2650 upside trading target. In this business when you are wrong, you say you are wrong and you say it quickly for a de minimis loss of capital. This morning the preopening futures are flat on no real overnight news. Near-term trading, however, could be influenced by Google’s earnings, which are due after the close.
Chart 1
Source: Bespoke Investment Group
Chart 2
Source: Bespoke Investment Group
Chart 3
Source: Bespoke Investment Group
Additional information is available on request. This document may not be reprinted without permission.
Raymond James & Associates may make a market in stocks mentioned in this report and may have managed/co-managed a public/follow-on offering of these shares or otherwise provided investment banking services to companies mentioned in this report in the past three years.
RJ&A or its officers, employees, or affiliates may 1) currently own shares, options, rights or warrants and/or 2) execute transactions in the securities mentioned in this report that may or may not be consistent with this report’s conclusions.
The opinions offered by Mr. Saut should be considered a part of your overall decision-making process. For more information about this report – to discuss how this outlook may affect your personal situation and/or to learn how this insight may be incorporated into your investment strategy – please contact your Raymond James Financial Advisor.
All expressions of opinion reflect the judgment of the Equity Research Department of Raymond James & Associates at this time and are subject to change. Information has been obtained from sources considered reliable, but we do not guarantee that the material presented is accurate or that it provides a complete description of the securities, markets or developments mentioned. Other Raymond James departments may have information that is not available to the Equity Research Department about companies mentioned. We may, from time to time, have a position in the securities mentioned and may execute transactions that may not be consistent with this presentation’s conclusions. We may perform investment banking or other services for, or solicit investment banking business from, any company mentioned. Investments mentioned are subject to availability and market conditions. All yields represent past performance and may not be indicative of future results. Raymond James & Associates, Raymond James Financial Services and Raymond James Ltd. are wholly-owned subsidiaries of Raymond James Financial.
International securities involve additional risks such as currency fluctuations, differing financial accounting standards, and possible political and economic instability. These risks are greater in emerging markets.
Investors should consider the investment objectives, risks, and charges and expenses of mutual funds carefully before investing. The prospectus contains this and other information about mutual funds. The prospectus is available from your financial advisor and should be read carefully before investing.
Copyright © Raymond James


.png)


