by Urban Carmel, The Fat Pitch
Summary: SPX has now gained 13% since Christmas Eve, while the Nasdaq is up 16%. After the recent plunge, it would be normal for the indices to give up most of their gains and retest the lows again. That's been a consistent pattern over the past 40 years. But when a plunge is followed by exceptional breadth like we have witnessed in the past month, a low retest has been unlikely.
Rapid plunges when the economy is still expanding - like now - are typically followed by strong forward returns. Moreover, it is encouraging that emerging markets, which have been the hardest hit by the threat of a trade war, reached a 4 month high this week. Those markets originally bottomed in October and retested those lows in December (a possible basing pattern).
It's certainly possible that some of the rapid gains since Christmas will be given back before SPX moves materially higher. A period of consolidation and retrenchment in the weeks ahead would not be surprising. The trade war isn't the only thing driving the market, but it has clearly been important and further deescalation will likely drive SPX to the top of its October-December range, just as reescalation could plunge it back towards its Christmas low.
* * *
The bounce that started on Christmas Eve took a small pause this week. Still, SPX has gained 13% since the low while the Nasdaq is up 16%. According the Ryan Detrick, this is the market's best January in at least 30 years (table from alphatrends.net). Enlarge any chart by clicking on it.
[highlight] What does a strong start to the year say about the remainder of 2019? Not much. [/highlight] Recall that SPX gained almost 6% in January 2018 and the year closed lower. That's true more generally; several other months are better predictors of the following 11 months than January (from Mark Hulbert).
The rally has brought SPX above the area where it failed in mid-December, initiating a 10% drop over 7 days (green shading). This is also where SPX bounced higher in February, April, May, October and November. SPX also closed above its 50-dma (the blue MA) the past 5 days in a row; this had been the top of its range since the September high (green arrows). Net, these are noteworthy signs of strength.
The persistence of strength in SPX is seen in the top panel (above). Strong markets are able to stay "overbought", weak ones are not. The rallies in October and November died as soon as momentum became overbought (blue arrows). In comparison, this time SPX has been able to move through resistance, digest gains and move higher. It's a tentative sign of an improved market character.
The big question is whether the low is in. Let's recap our recent studies.
First: when SPX drops 15% or more, it has a strong tendency to retest those lows in the weeks/months ahead. Since 1980, there have been at least 10 of these periods and all but two retested the low before moving higher. The two exceptions were 1982 and 2009, both major lows following bear markets that lasted 21 and 17 months, respectively. On the surface, those two exceptions don't have much in common with the current, short, 3 month drop. A post on this is here.
So, it would seem a low retest is all but certain, except...
Second: in the past 70 years, exceptionally strong breadth like we have seen since the Christmas low has never taken place within the context of a bear market. In fact, breadth momentum like this is often associated with the start of new bull markets. There have been 18 "breakaway breadth thrusts" since 1962 and only one was followed by a low retest (and it was a higher low). A post on this is here (table from @twillo1).
Why is the evidence split, with falls greater than 15% having low retests but breadth thrusts not? Since 1980, the large falls without a low retest were all followed by a breadth thrust; that includes both 1982 and 2009 as well as the second low in February 2016. In comparison, when SPX fell back to test its prior low, a breadth thrust was missing every time. In short, the breadth thrust seems to have made the key difference.
Net, given the exceptional breadth seen since the Christmas low, it would appear that a low retest is highly unlikely.
Other evidence suggests that the Christmas low will likely hold and that forward returns for equities will be favorable.
From Christmas Eve, SPX has gained more than 1.5% for four weeks in a row. This has happened just 10 times in the past 90 years. With just one exception, returns within the next year were exceptional, ranging from a low of 13% to a high of 38% (blue boxes). Risk/reward was biased more than 3:1 positive over the next month and more than 5:1 positive from 3 to 12 months later (from Sentimentrader; to become a subscriber and support the Fat Pitch, click here).
Moreover, the strong breadth has continued in the two weeks since the breadth thrust. The McClellan Oscillator (NYMO; a measure of breadth momentum) has exceeded 100 five times this year; for reference, it exceeded 100 only four other times in the past 20 years.
As a result, the Summation Index (NYSI; which simply sums NYMO every day) is likely to exceed 500 in the coming week. Since 2003, when NYSI crossed from less than zero to more than 500, the low in SPX has been in. Moreover, NYSI never exceeded 500 during the entirety of the 2007-09 bear market. This suggests the odds of the Christmas low holding are very good, although some interim weakness is possible (see 2010 and 2011).
In addition, the plunge in equities occurred while macro data continued to be non-recessionary. This week, unemployment claims fell to their lowest level since November 1969. Likewise, high yield spreads never rose anywhere near the levels seen during similar market swoons in 2011 and 2016, and have since declined. This part of the bond market is not signaling any underlying trouble.
To be sure, growth is likely to slow this year. Earnings growth in 2018 was near 20% yoy. Since November, expectations for 2019 have fallen from 10% to 6% and will likely fall further as the year goes on (more on that here). In 1Q19, EPS growth will likely be less than 1% yoy (yellow shading; from FactSet).
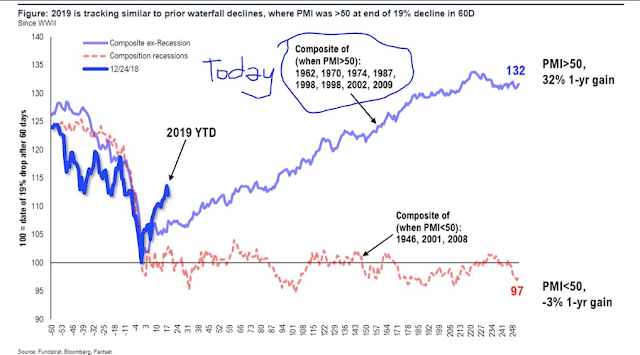
During the recent correction, SPX plunged about 20% in 60 days. This is rare, occurring only 10 times in the past 70 years. When this happened while the economy was non-recessionary, SPX continued to trend higher over the next year, gaining an average of 30% (blue line). When the plunge happened during a recessionary environment, SPX continued to fall (red line; from Tom Lee).
Interestingly, most of the non-recessionary dates in the chart above also experienced a breadth thrust (exceptions: 1998 and 2002). The recessionary dates all did not.
It's certainly possible that some of the gains since Christmas will be given back before SPX moves materially higher. A 13% gain in just 21 days is extreme. Again referring to the chart above, the average gain by 21 days is about half of what we have seen so far. So a period of consolidation and retrenchment in the weeks ahead would not be surprising.
A lot may well depend on what happens next in the trade war. The sell off a year ago began as trade war rhetoric was first invoked. The 10% plunge in December began when the president declared himself to be the Tariff Man. The rise since Christmas has coincided with talk of compromise and concessions. The trade war isn't the only thing driving the market, but it has clearly been important and further deescalation will likely drive SPX to the top of its October-December range, just as reescalation could plunge it back to its Christmas low.
But the plunge in equities was accompanied by an evacuation by investors. There is no historical comparison to fund outflows seen during this period, even if the data is normalized for a larger market size. The rebound has moderated those outflows, but they are still negative on a 4-week basis. Even in a bear market, fund inflows will be higher (i.e., bullish sentiment will be stronger) before a rollover transpires (from Willie Delwiche).
Likewise, sentiment amongst analysts has not rebounded very strongly, yet (blue line). It would be unusual for there to be much downside until this improves further (from Helene Meisler).
The coming week looks pivotal. Vix is sitting at the bottom of its 4 month range from which every big sell off in SPX has started (circles in lower panel). SPX is holding on to the bottom of its trading range from October to early December (upper panel). A drop in Vix under 16 probably corresponds with SPX grinding its way back to the top of this range, near the 2800 area.
The threat of trade war hit emerging markets hardest. They peaked in January and never looked back. But this week, EEM closed at a 4 month high. The down trend from January was broken (top dashed line) and the region appears to now be exiting a 4 month base (yellow shading). Of note, the region also completed a low retest between October and December (bottom dashed line).
Likewise, South Korea is often considered a good proxy for global trade. The Kospi index ended the week at the top of its 4 month range (yellow shading) and has also put in a double bottom (arrows).
On the calendar this week: FOMC and the first look at 4Q18 GDP on Wednesday, PCE on Thursday and NFP on Friday (from IBD Investors; for a trial subscription, please use this link).
Copyright © The Fat Pitch


