
Following the 23% decline in valuations, investors are better compensated for an uncertain future
by Jurrien Timmer, Director of Global Macro, @TimmerFidelity
Key takeaways
• In 2018 the stock market was caught in the crosshairs of the discounted cash flow model (DCF), with a temporary earnings boom fully offset by a falling P/E multiple.
• In 2019, I think we will get more clarity on both the earnings side and the interest rate side of the DCF.
• If growth in earnings per share (EPS) moderates to 5% to 7% and the U.S. Federal Reserve stops at or below the neutral rate (around 2.5%), then P/E valuations could put us in reasonable shape for 2019.
• But if earnings growth comes in substantially below that range, or the Fed commits a policy error, then the correction of 2018 likely will continue well into 2019.
The market is a three-dimensional puzzle For me, the stock market is a three-dimensional math puzzle that’s both elegantly simple yet impossible to solve. It’s a paradox that reminds me of many other aspects of life.
I am a firm believer in the discounted cash flow model because it reflects all the major pieces of the stock market puzzle: earnings, interest rates, valuation, and sentiment. The problem is the DCF requires three inputs: earning, rates, and the risk premium. Predicting each individually is hard enough, but getting all three right is close to impossible. But that’s what we need to do to solve for valuation—and therefore price.
According to the DCF, the market’s fair value—or the price investors should be willing to pay for each dollar of future earnings—is driven by sustainable earnings growth (the numerator, or E) and the cost of capital (the denominator, or r). The latter is the sum of the risk-free rate (10-year Treasury yield) plus an estimate of the equity risk premium (ERP).
If we could solve for the market’s fair value (its price-toearnings ratio, or P/E), the rest would be easy in that the direction of stock prices simply becomes a function of earnings growth and the P/E. So, if we could know the E and the r, then we could know the P/E, and once we knew the P/E we could potentially solve for the P; easy! (NOT! Quite difficult, actually...)
It’s basic math. For example, if the S&P 500® is trading at a 17x P/E multiple and earnings grow by 10% and dividends yield 2%, then the index will return 12%. If, in addition, the P/E ratio expands to, say, 19x, then the return jumps from 12% to 25%.
That’s a big difference—and a good reminder that while most people tend to focus on price levels (“Where’s the Dow trading?”), what really matters is valuation, i.e., what investors are willing to pay for each dollar of earnings. So, it’s the combination of earnings and valuation that drives price in the stock market.
2018: A year of market purgatory
This puzzle has been playing out in a big way. 2018 will go down as the year when earnings growth boomed (up 24%), yet the stock market moved only sideways. Aren’t stock prices supposed to follow earnings? Well, historically they have over the long run, but the degree to which they do so depends on where valuations go, and that depends on liquidity conditions, risk premia, and the sustainability of earnings growth.
While the 24% growth rate in calendar year (CY) 2018 earnings is surely impressive, it was never going to be sustainable, in my opinion, and investors tend not to pay for temporary earnings spikes. With CY2019 earnings growth estimates already falling from roughly 12% to below 10%, the 2018 spike has proven to be fleeting.
Not that 10% is anything to sneeze at, but it’s not 24%. Meanwhile, companies’ cost of capital has been rising as the U.S. Federal Reserve has been tightening its monetary policy at a steady clip and credit spreads have widened. As a result, liquidity conditions have grown more restrictive. That affects the DCF’s numerator.
Between investors worrying about the sustainability of earnings growth and the tightening of financial conditions, the net result has been that the market’s P/E has undergone a substantial de-rating in 2018.
At the S&P 500’s January 26 peak of 2873, the forward P/E—based on projected EPS for the next 12 months (N12M)—was 19.5x, and the trailing 12-month P/E was 21.9x. At its October low, these S&P 500 P/Es were down to 15.0x and 16.7x, respectively. That’s a 23% devaluation in terms of what investors were willing to pay for each dollar of current and projected earnings. Is that enough of a concession? To me, that’s the big question as we head into 2019.
Obviously, U.S. trade tension with China is playing a large role in this re-rating, given the stagflationary impact that protectionism can be expected to have on the economy and therefore corporate profits. For those with a zero-sum mindset, it can be tempting to assume that tariffs will hurt only Chinese companies.
But the reality is that, to varying degrees, a price will be paid by everyone, including U.S. consumers and companies. Tariffs could either cause prices to rise (if companies can pass costs on to consumers) or cause profit margins to shrink (if they can’t), neither of which is good for equity valuations. The risks to the supply chain are formidable as well, given the “just-intime” inventory structure of today’s global economy.

Solving the puzzle for 2019 I think 2019 will probably prove a continuation (and likely a conclusion) of the themes that have been driving markets in 2018. First: Where is earnings growth heading now that the temporary spike has worked its way through the system, and how sustainable will it be? Is the EPS growth rate 10%? 5%? Zero?
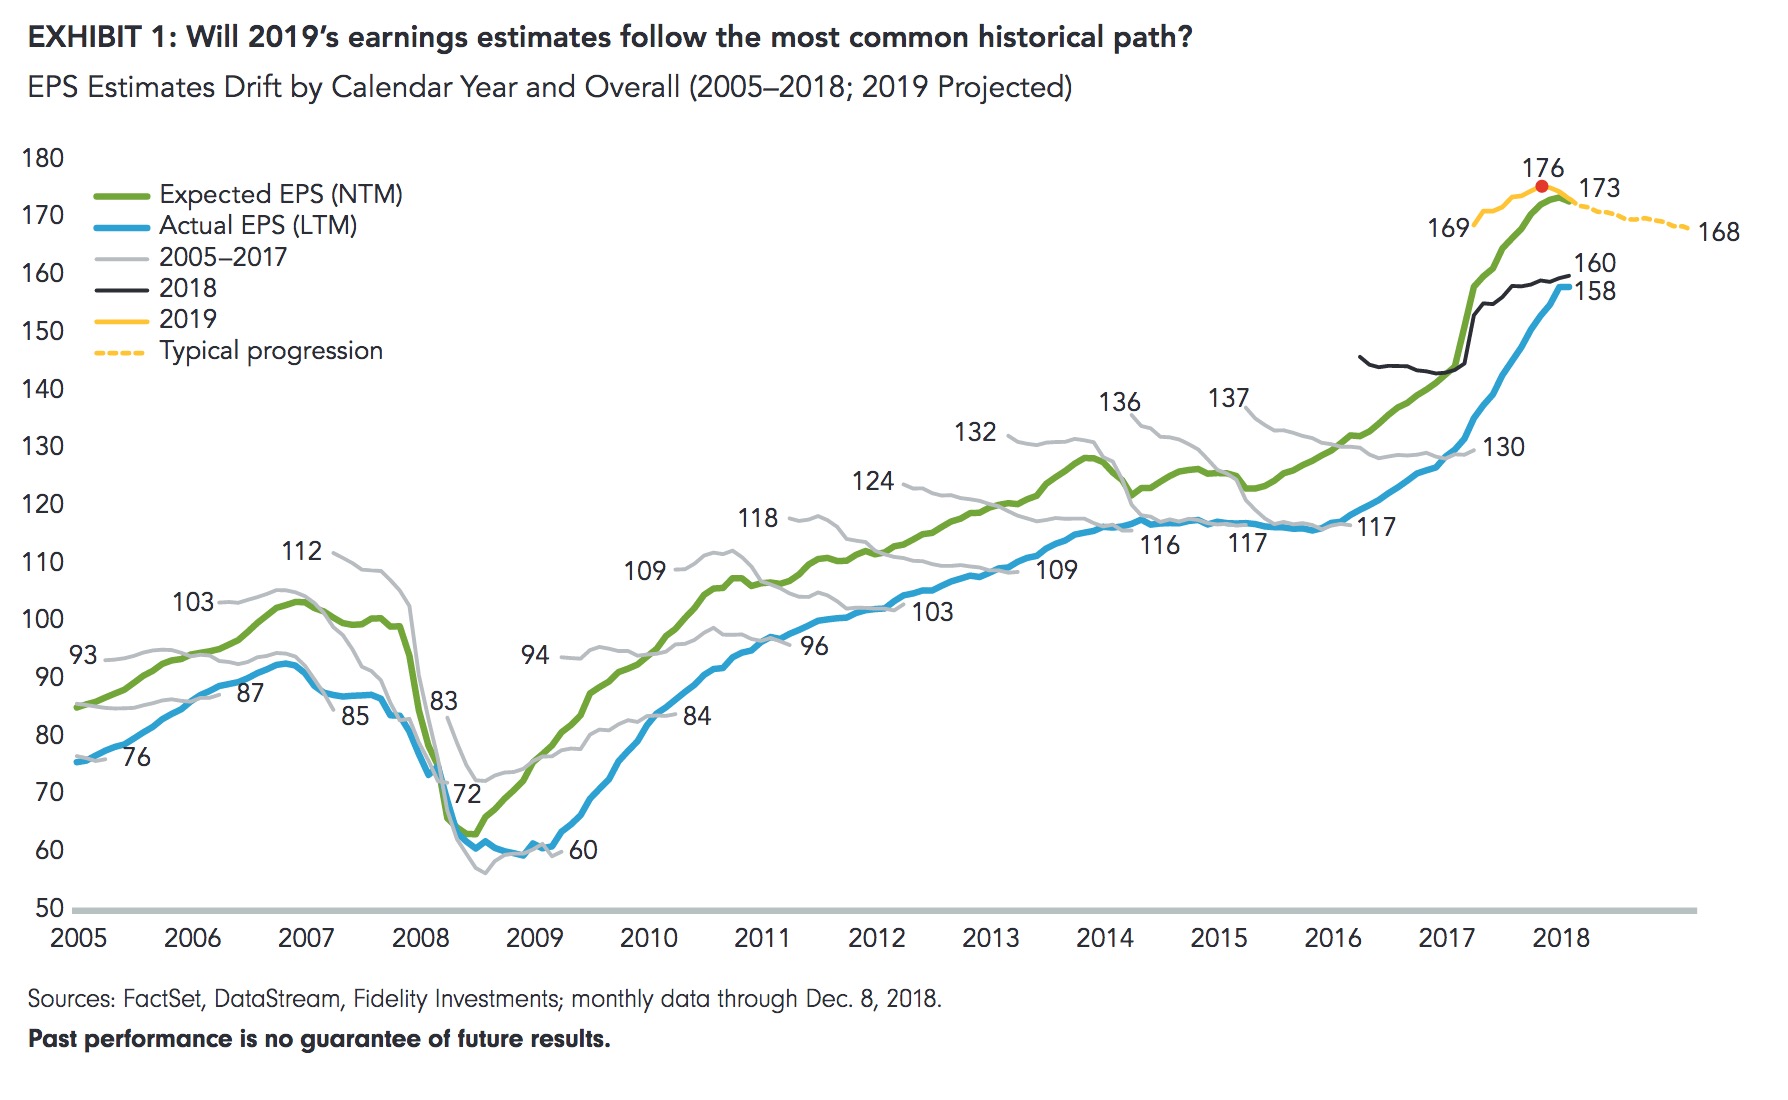
Consensus estimates for CY2019 are at 9.3% and drifting lower, as they’ve historically had a habit of doing as the months pass. Companies are inclined to under-promise and over-deliver, so estimates tend to fall leading up to a reporting period (Exhibits 1 and 2).
If the historical progression of earnings estimates is any guide, chances are that CY2019’s EPS growth rate will end up at around 5% to 7%, in line with the historical trend of 6% to 7%. By my math, that translates to a CY2019 EPS of $168 for the S&P 500 overall; current estimates are for $173 and, for the last 12 months (LTM), $158. Even the lowered $168 number could have downside risk if U.S.–China trade tension escalates further.
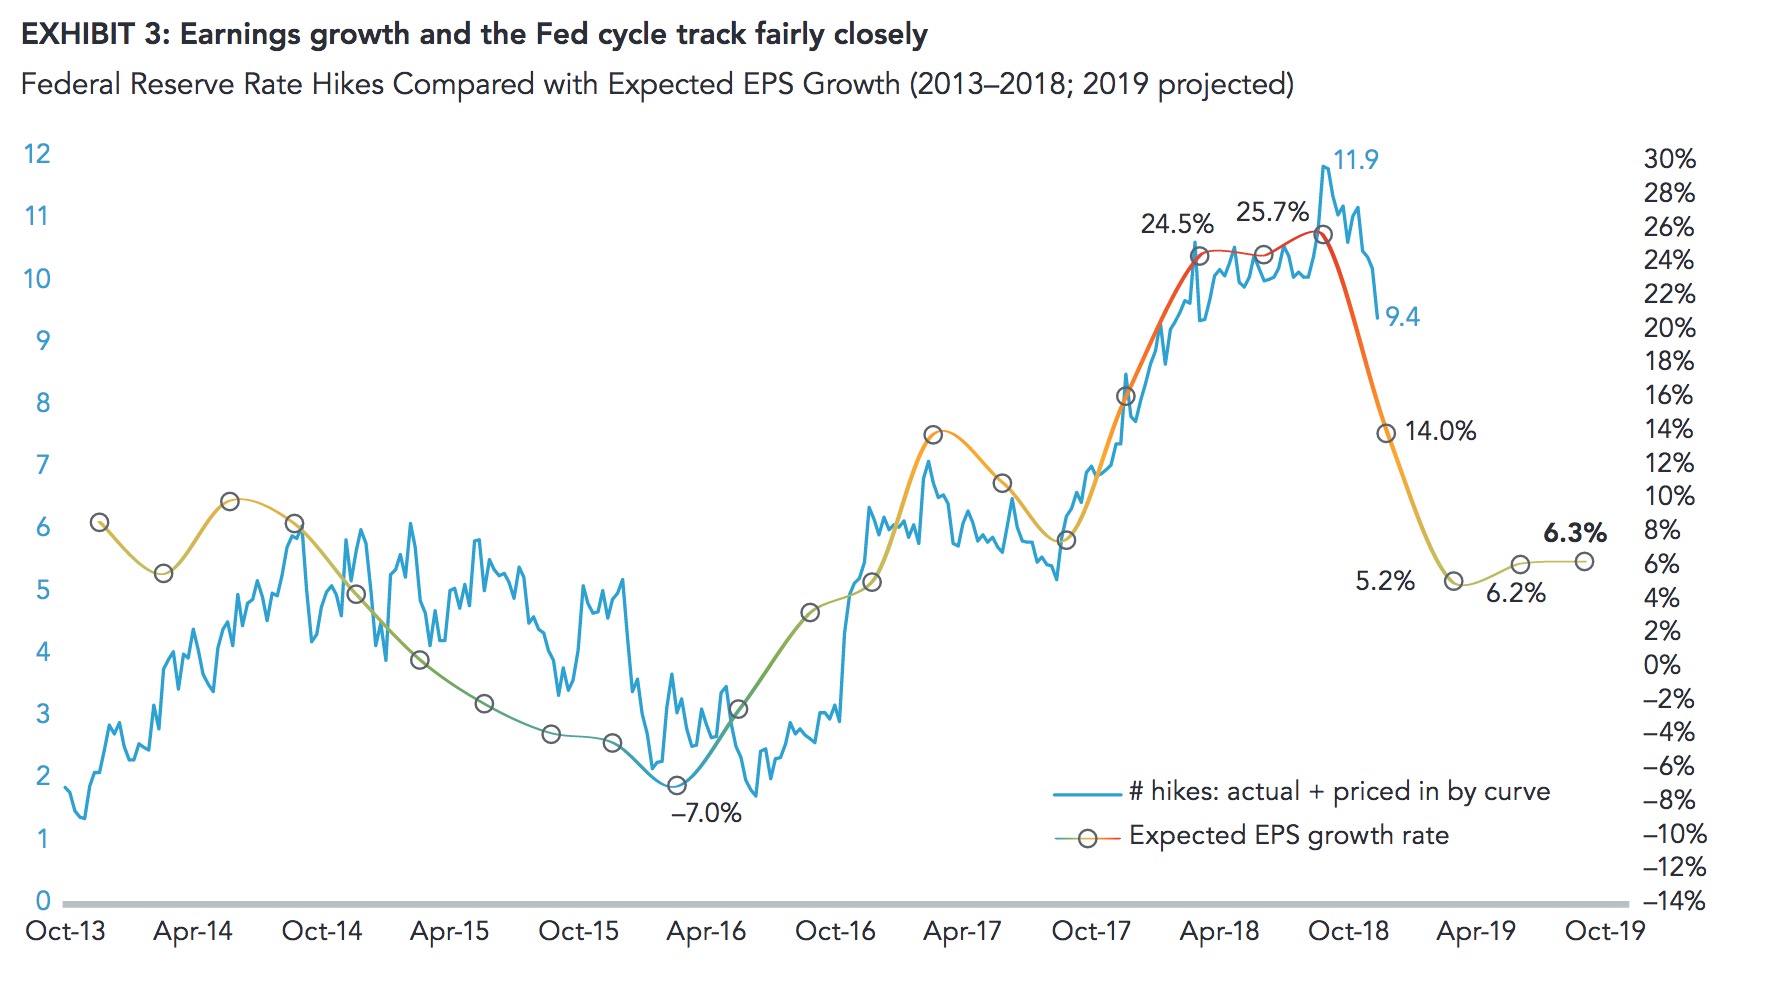
Second: What will happen to the cost of capital, which in turn affects EPS estimates (Exhibit 3)? This will largely depend on what happens to Fed policy in 2019 (which could affect the risk-free rate), as well as market sentiment (impacting the risk premium).
We know the Fed has raised its federal funds target rate eight times—by a total of 200 basis points (bps) since late 2015—and just went for a ninth hike. On top of that, the Fed has been further tightening financial conditions by shrinking its balance sheet. We also know that the Fed’s so-called dot plot—depicting all 16 Federal Open Market Committee (FOMC) members’ individual projections of where the policy rate will be—has been suggesting another five hikes over the coming two years (now down to two, following the December 18 hike), a prospect that the market has been struggling with the past few months.
More recently, following a broad-based deterioration in various market barometers, Federal Reserve Chair Jerome Powell has hinted that he may slow the pace of remaining rate hikes as the Fed has now gotten closer to the low end of what it considers the neutral zone (estimated to be in the range of 2.5% to 3.0%). That suggests a switch from autopilot (one hike per quarter) to a more data-dependent policy may be in order.
I think this makes sense for a number of reasons. First, “R-Star”—the neutral real interest rate at which monetary policy is neither accommodative nor restrictive—is a theoretical construct that cannot be observed in real time, so as we get closer to it, it’s wise for the Fed to not get too formulaic in terms of how or when it gets to the end of its normalization process. In this way, with his now more pragmatic risk-management approach, Chairman Powell seems to be channeling former Chair Alan Greenspan a bit.
Second, while the 11% sell-off in the S&P 500 earlier this year was never going be enough to sway the Fed, the more recent 11% decline has been different. Unlike the TIPS refers to Treasury inflation-protected securities. The break-even rate refers to the difference between the yield on a nominal fixed-rate bond and the real yield on an inflation-linked bond of similar maturity and credit quality.
The credit spread is the yield spread that must be added to a benchmark yield curve to discount a security’s payments to match its market price, using a dynamic pricing model that accounts for embedded options. The 5y/5y breakeven is a measure of expected inflation (on average) over the five-year period that begins five years from today.
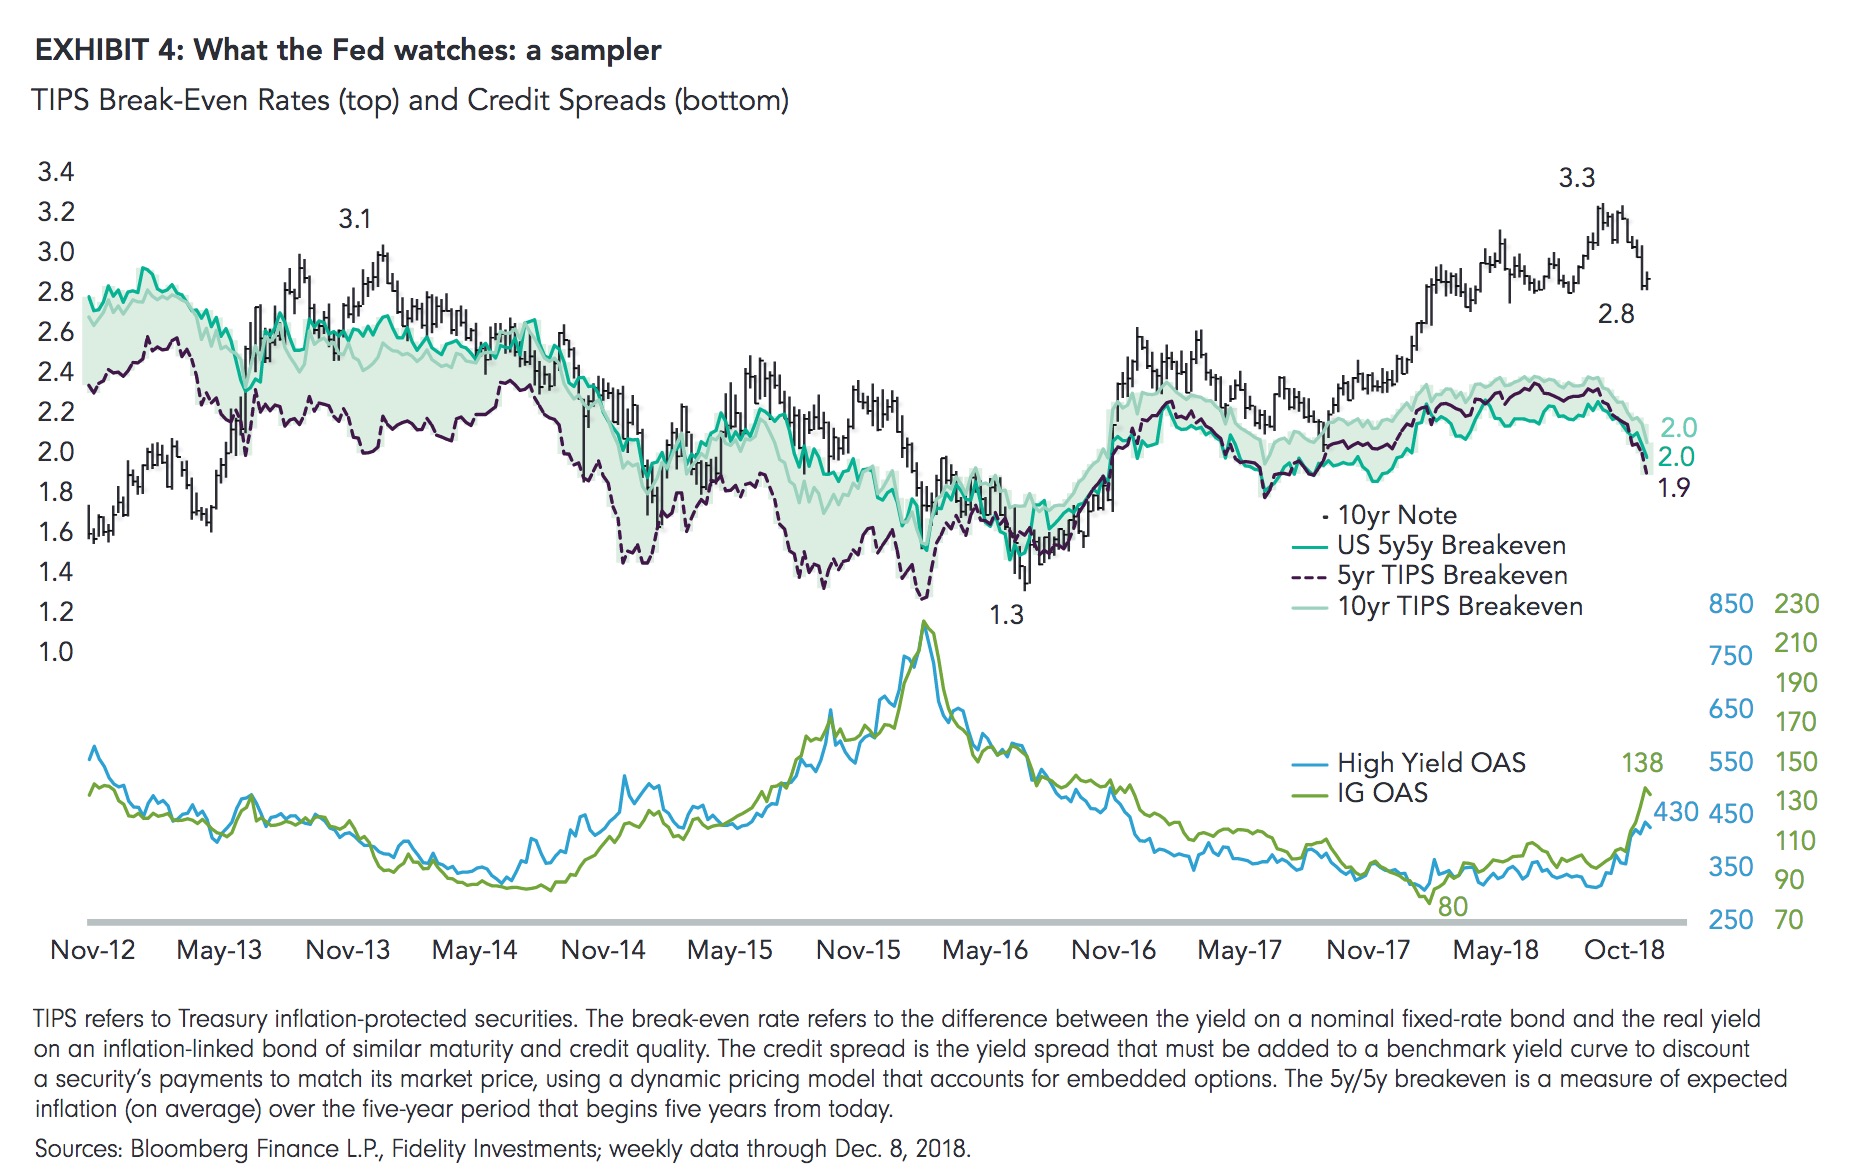
Markets are contemplating an end to Fed hikes Treasury Yields and Expectations for Federal Reserve Interest Rate Actions January/February correction, the October/November correction has been much more broad-based, affecting not only stock values but also credit spreads, commodity prices, and inflation expectations. The Fed rightfully pays attention to all of these inputs (Exhibit 4) and, at least to me, they all seem to be screaming, “Slow down!”
This dovish pivot, needless to say, has been welcomed by the markets, not only because it diminishes the risk of a policy error, but because it gives investors better clarity on where this Fed cycle may end and when. With a ninth rate hike announced after the FOMC meeting on December 18–19, the bond market is now expecting just one more hike for the cycle, sometime in 2019. In fact, the forward curve starts to decline beyond 2019, which means that many in the market have begun to price in a rate cut in 2020 (Exhibit 5).
If the forward curve is correct and the Fed is almost done, then I think this should be a fairly benign outcome for rates and liquidity conditions, which feed into the DCF’s denominator. That, of course, still leaves the Fed’s balance sheet taper as an unknown risk, as its effect on liquidity conditions remains difficult to quantify.
So, let’s assume that earnings grow 5% to 7% in 2019 and the Fed stops hiking the fed funds rate at the 2.5% to 2.75% level. That suggests to me that the risk-free rate (10-year Treasury) is reasonably priced at around 3.0%. If the implied equity risk premium (currently running roughly 2%) remains as is, then the overall cost of capital should be supportive at around 5%: That’s near historical lows.

In my view, positive earnings growth combined with a reasonable cost of capital should produce a modestly favorable outcome for the stock market, and is supportive of mid- to high-single-digit gains in 2019. That’s assuming no further re-rating or de-rating in the stock market’s P/E ratio, which is currently registering around a 15x to 16x multiple. If valuations move up from here, we could quickly get into the double digits in terms of total return. But if valuations continue to contract as they have done so far in 2018, further compression of P/E multiples could offset any earnings gains, leaving the market with little or no progress in 2019.
What are the risks?
The obvious risk to this relatively benign outcome is that (A) earnings growth slows much more than expected— or even contracts; and/or (B) the Fed commits a policy error either by raising rates past the market’s ability to withstand or by failing to cut rates if and when needed. A Federal Reserve policy error seems less likely now that the Fed has already pivoted away from its hawkish stance of a few months ago, and the scenario of a Fed needing to cut rates seems like an outlier to me, given the apparent strength of the U.S. economy.
Option A is something that’s harder to predict, in my view. While I see little or no evidence of a U.S. recession on the horizon, many market professionals are sounding the alarm of an ever-flattening yield curve. The predictive value of an inverted yield curve is well-documented of course, and with the long end of the bond market now falling back below 3% and the Fed expected to raise rates at least one more, the spread between the 10-year yield and the 2-year yield (the 2y10y curve) is on the cusp of inverting.

I suspect these inversion fears will prove premature. Most market folks are pointing to the 2y10yr curve, but I have never been a fan of that spread, instead preferring the 3m10y (10-year minus 3-month yield) curve as a purer expression of the term structure. And the fact is that, at 46 bps, the 3m10y spread is still positive by about two Fed hikes (assuming no change in the 10-year Treasury yield).
According to the forward curve, that’s likely more hikes than we will get anyway. So let’s take a breath, people.
And even if the curve were to invert, it remains to be seen how effective that signal would be during this particular cycle, given the degree to which the shape of the curve has been distorted by the negative term premium. (The term premium is the excess yield investors require to commit to holding a long-term bond instead of a series of shorter-term bonds). In 2014, after years of quantitative easing and low inflation expectations, the historically positive term premium turned negative. For instance, taking the 1994 Fed cycle analog (which bears a striking resemblance to today’s cycle in terms of the direction of both the stock market and the yield curve), if we adjust today’s negative term premium for the positive term premium back, then you can see how much further the curve would be from inverting today (Exhibit 6).

Conclusion
With the caveat that the discounted cash flow model is an impossible-to-solve riddle, my sense is that the slowdown in earnings growth from 24% in 2018 to possibly 5% to 7% in 2019, against expectations that the Fed will hike rates only once or twice more, is not such a bad outcome.
The question, then, is: What’s the right valuation? What is the P/E haircut that is warranted for a scenario in which earnings growth is decelerating (but remains positive) and the Fed is still tightening but stops short of neutral? Is a 15x forward P/E multiple and a 16.7x trailing P/E multiple enough of a concession?
With investors embracing the inverted yield-curve playbook and worrying about U.S.–China trade, it’s easy to see why markets are so nervous, but in my view a 20%- plus haircut in the P/E ratio is decent compensation as we head into 2019 (Exhibit 7).
Needless to say, if we are heading into a recession and an earnings contraction, then all bets are off. But at this point there’s little evidence that this will happen in the U.S. any time soon.
*****
Jurrien Timmer | Director of Global Macro, Fidelity Global Asset Allocation Division
Jurrien Timmer is the director of Global Macro for the Global Asset Allocation Division of Fidelity Investments, specializing in global macro strategy and tactical asset allocation. He joined Fidelity in 1995 as a technical research analyst.
Author
For more information on this topic, visit FidelityConnects on fidelity.ca This is original content from Fidelity Investments in the U.S.
The source of all factual information and data on markets, unless otherwise indicated, is Fidelity Investments. Commissions, trailing commissions, management fees and expenses all may be associated with mutual fund investments. Please read the prospectus, which contains detailed investment information, before investing. Mutual funds are not guaranteed, their values change frequently and past performance may not be repeated. Certain Statements in this commentary may contain forward-looking statements (“FLS”) that are predictive in nature and may include words such as “expects”, “anticipates”, “intends”, “plans”, “believes”, “estimates” and similar forward-looking expressions or negative versions thereof. FLS are based on current expectations and projections about future general economic, political and relevant market factors, such as interest and assuming no changes to applicable tax or other laws or government regulation. Expectations and projections about future events are inherently subject to, among other things, risks and uncertainties, some of which may be unforeseeable and, accordingly, may prove to be incorrect at a future date. FLS are not guarantees of future performance, and actual events could differ materially from those expressed or implied in any FLS. A number of important factors can contribute to these digressions, including, but not limited to, general economic, political and market factors in North America and internationally, interest and foreign exchange rates, global equity and capital markets, business competition and catastrophic events. You should avoid placing any undue reliance on FLS. Further, there is no specific intentional of updating any FLS whether as a result of new information, future events or otherwise.
From time to time a manager, analyst or other Fidelity employee may express views regarding a particular company, security, and industry or market sector. The views expressed by any such person are the views of only that individual as of the time expressed and do not necessarily represent the views of Fidelity or any other person in the Fidelity organization. Any such views are subject to change at any time, based upon markets and other conditions, and Fidelity disclaims any responsibility to update such views. These views may not be relied on as investment advice and, because investment decisions for a Fidelity Fund are based on numerous factors, may not be relied on as an indication of trading intent on behalf of any Fidelity Fund. Stock markets are volatile and can fluctuate significantly in response to company, industry, political, regulatory, market, or economic developments. Please note that there is no uniformity of time among business cycle phases, nor is there always a chronological progression in this order. For example, business cycles have varied between 1 and 10 years in the U.S., and there have been examples when the economy has skipped a phase or retraced an earlier one.
Investing involves risk, including risk of loss.
Past performance is no guarantee of future results.
Diversification and asset allocation do not ensure a profit or guarantee against loss.
All indices are unmanaged. You cannot invest directly in an index.
Index definitions
Standard & Poor’s 500 (S&P 500®) index is a market capitalization-weighted index of 500 common stocks chosen for market size, liquidity, and industry group representation to represent U.S. equity performance. S&P 500 is a registered service mark of The McGraw-Hill Companies, Inc., and has been licensed for use by Fidelity Distributors Corporation and its affiliates.
Goldman Sachs Financial Conditions Index tracks changes in interest rates, credit spreads, equity prices, and the value of the U.S. dollar. A decrease in the index indicates an easing of financial conditions, while an increase indicates tightening.
Third-party marks are the property of their respective owners; all other marks are the property of Fidelity Investments Canada ULC.
© 2018 Fidelity Investments Canada ULC. All rights reserved.
U.S.: 870034.1.0 CAN: 110936-v20181221