by Frank Holmes, CIO, CEO, U.S. Global Investors
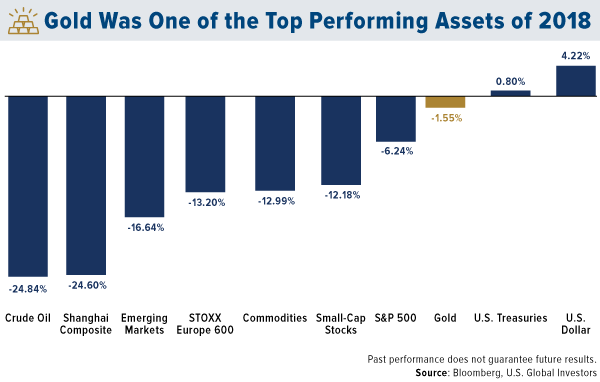
King Dollar was on top in 2018, one of the few major assets to close the year in the black on steady interest rate hikes and robust economic growth in the U.S. But greenback strength is a double-edged sword, as you know. Although good for U.S. consumers, it can hamper exporters, commodities, oil, gold and more.
So will rates continue to rise in 2019? If so, the dollar will follow suit, putting additional pressure on other assets. I think there are a number of signs that the rate hike we saw in December could be the last one this cycle. Just this past Friday, Federal Reserve Chairman Jerome Powell commented that “we will be patient” with further rate hikes, which I believe is good news.
I’ll have more to say on rates in a second.
Under the circumstances, I’m very pleased with how well gold performed last year. It’s doing what it’s supposed to do. Stocks began to sell off late in the year, boosting investor demand for safe haven assets. As I explained in a Frank Talk last week, the yellow metal beat the S&P 500 Index for the month of December, the fourth quarter and the year. It’s also outperforming the market so far in the 21st century.
click to enlarge
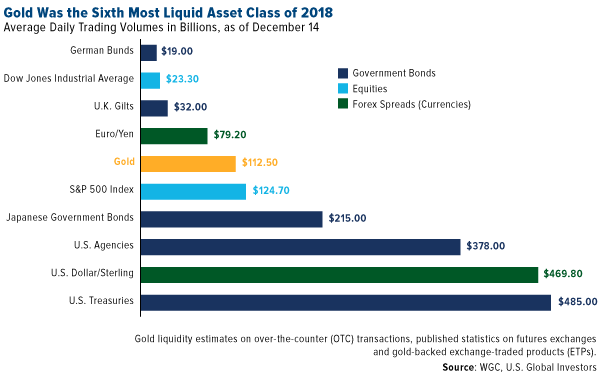
Gold was also one of the most liquid assets of 2018, with daily trading volumes in the same neighborhood as S&P 500 companies, according to the World Gold Council (WGC). I can’t stress enough how important this is, as it underscores the maturity and trustworthiness of the gold market. The WGC puts it well: “Clarity and transparency in financial markets is beneficial to investors as it increases their level of comfort and their understanding of an asset.”
click to enlarge
Investors Are Betting That the Fed Hits the Pause Button
Back to interest rate policy. Again, I think Powell’s pledge to “be patient” is good news and shows that he’s willing to listen to those who have very publicly expressed their objection to further rate increases, including investing heavyweights such as Jeffrey Gundlach and Stanley Druckenmiller. Last Thursday, the Dallas Fed president, Robert Kaplan, said he supported putting additional rate hikes on hold to see how the global economy plays out.
“I would be an advocate of taking no action… in the first couple of quarters this year,” Kaplan told Bloomberg.
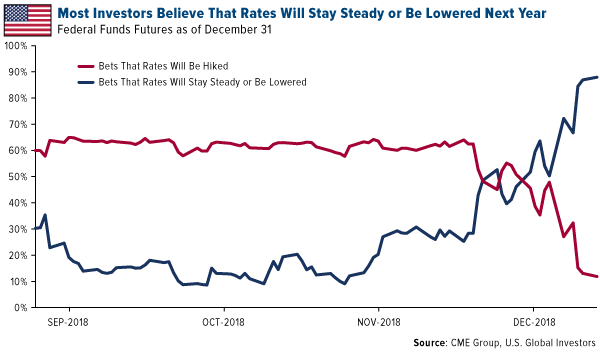
Investors seem to agree. Last month, the CME Group’s FedWatch Tool showed an 87 percent probability that the fed funds rate would either stay where it is now or be lowered by the end of 2019. That’s up dramatically from less than 10 percent in October. Meanwhile, bets that the rate would rise in 12 months’ time have dropped to around 12 percent.
click to enlarge
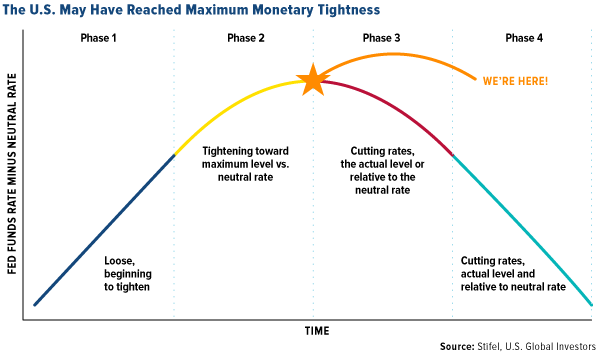
In a note to investors last week, Stifel shared its belief that the Fed “has reached historical maximum tightness,” arguing that the central bank must “wait for the neutral rate to rise” before tightening again, or else risk “credit deterioration, recession and a deep bear market.” (The “neutral rate” is not set by the Fed but a reflection of the fed funds rate that “keeps output growing around its potential rate in an environment of full employment and stable inflation,” in the words of Fed Board Governor Lael Brainard.) According to the investment bank, we’re right at the peak of the interest rate cycle, somewhere between phase two (characterized by tightening) and phase three (characterized by easing).
click to enlarge
“The Fed has taken restrictive policy to its very limits, and we see further S&P 500 downside if they do not stop tightening for most (or all) of 2019,” writes Stifel strategist Barry Bannister. “There are signs the Fed may stand down and wait for the neutral rate to rise.”
Possible Implication? A Weaker U.S. Dollar
One of the possible implications of a less aggressive Fed in 2019 is a weaker dollar—especially if the European Central Bank (ECB) begins tightening later this year, as some analysts predict. As I’ve explained before, once the dollar starts to lose ground relative to other world currencies, gold could rocket up to as much as $1,500 in the blink of an eye.
Among those that are bearish on the greenback is Citi, which wrote in a note last week that the greenback “may more than reverse [2018’s] rally over the medium term.” The bank predicts 12 percent downside versus other major currencies, citing the flattening (and, in one case, already inverted) yield curve as a signal of weaker economic growth.
Mike McGlone, commodity strategist at Bloomberg Intelligence, believes dollar mean reversion will be the theme in 2019, which would favor gold and commodities. “It’s unlikely for 2019 that the dollar will remain atop the list of best-performing assets,” according to McGlone, who adds that “markets appear in the transition phase of passing the bull market baton from U.S. stocks to commodities.”
Manufacturing Expansion Continues to Slow
Besides a strong dollar, the big risk to commodities right now is weaker demand from factories, which is turning up in the purchasing manager’s index (PMI).
The JPMorgan Global Manufacturing PMI fell to a 27-month low of 51.5 in December, down from 52.0 a month earlier. Amazingly, business confidence among global manufacturers dropped to its lowest level in the series history, according to David Hensley, JPMorgan’s director of global economic coordination.
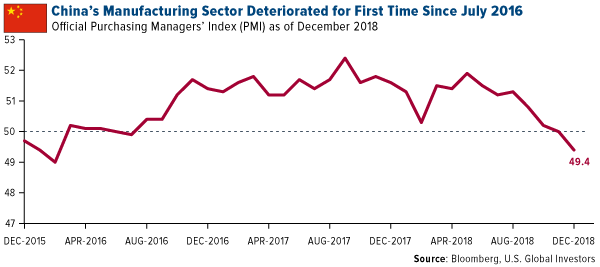
China’s manufacturing sector, meanwhile, contracted last month. Its official PMI reading fell slightly, from a neutral 50.0 in November to 49.4, as declining domestic demand and U.S. trade tariffs are squeezing the world’s second-largest economy. The price of copper hit a three-and-a-half-month low this week on the news.
click to enlarge
U.S. factories also slowed in December, down sharply from 59.3 in November to 54.1 in December. That’s the most the gauge has fallen, in percentage-point terms, since the Great Recession.
Because the PMI is a forward-looking indicator of economic health, I urge investors to be cautious. And keep your eyes on the yield curve. The spread between the 10-year Treasury yield and three-month Treasury yield narrowed to only 15 basis points last Thursday, its lowest level since September 2007—just a couple of months before the start of the financial crisis. An inverted yield curve, remember, is a sign that investors believe economic trouble could be near at hand.
The dollar looks positioned to revert back to its mean, and that’s when you want to have some exposure to gold. Keep in mind the 10 Percent Golden Rule—5 percent in gold bullion, the other 5 percent in well-managed gold mutual funds and ETFs.
All opinions expressed and data provided are subject to change without notice. Some of these opinions may not be appropriate to every investor. By clicking the link(s) above, you will be directed to a third-party website(s). U.S. Global Investors does not endorse all information supplied by this/these website(s) and is not responsible for its/their content.
The S&P 500 Stock Index is a widely recognized capitalization-weighted index of 500 common stock prices in U.S. companies. The Dow Jones Industrial Average is a price-weighted average of 30 blue chip stocks that are generally leaders in their industry. The Shanghai Composite Index (SSE) is an index of all stocks that trade on the Shanghai Stock Exchange. The STOXX Europe 600 Index is derived from the STOXX Europe Total Market Index (TMI) and is a subset of the STOXX Global 1800 Index. With a fixed number of 600 components, the STOXX Europe 600 Index represents large, mid and small capitalization companies across 18 countries of the European region: Austria, Belgium, Czech Republic, Denmark, Finland, France, Germany, Greece, Ireland, Italy, Luxembourg, the Netherlands, Norway, Portugal, Spain, Sweden, Switzerland and the United Kingdom.
The J.P. Morgan Global Purchasing Manager’s Index is an indicator of the economic health of the global manufacturing sector. The PMI index is based on five major indicators: new orders, inventory levels, production, supplier deliveries and the employment environment.
The FedWatch Tool calculates unconditional probabilities of Federal Open Market Committee (FOMC) meeting outcomes to generate a binary probability tree. CME Group lists 30-Day Federal Funds Futures (FF) futures, prices of which incorporate market expectations of average daily Federal Funds Effective Rate (FFER) levels during futures contract months. The FFER is published by the Federal Reserve Bank of New York each day, and is calculated as a transaction-volume weighted average of the previous day’s rates on trades arranged by major brokers in the market for overnight unsecured loans between depository institutions.
In finance, mean reversion is the assumption that a stock's price will tend to move to the average price over time.
A basis point, or bp, is a common unit of measure for interest rates and other percentages in finance. One basis point is equal to 1/100th of 1%, or 0.01% (0.0001).
This post was originally published at Frank Talk.
Copyright © U.S. Global Investors

