by Frank Holmes, CIO, CEO, U.S. Global Investors
Share this page with your friends:
Please note: The Frank Talk articles listed below contain historical material. The data provided was current at the time of publication. For current information regarding any of the funds mentioned in these presentations, please visit the appropriate fund performance page.
January 2, 2019
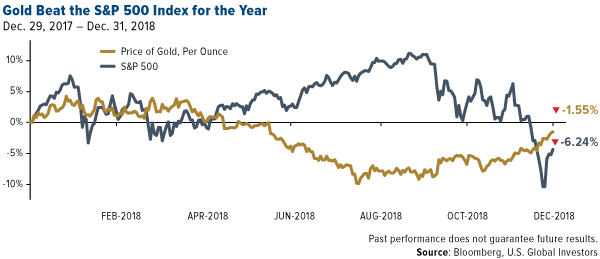
Global uncertainty made gold a holiday winner for investors seeking a relatively safe haven. U.S. stocks just logged their worst year since 2008—their worst December since 1931—as fears over global trade, ballooning debt, the end of accommodative central bank policy and a U.S. government shutdown unsettled investors. Against this backdrop, the price of gold rallied late in 2018, reversing a trend of negative returns and weak investor demand that prevailed for most of the year.
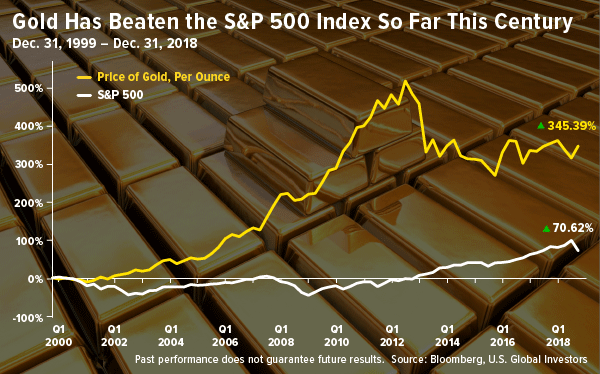
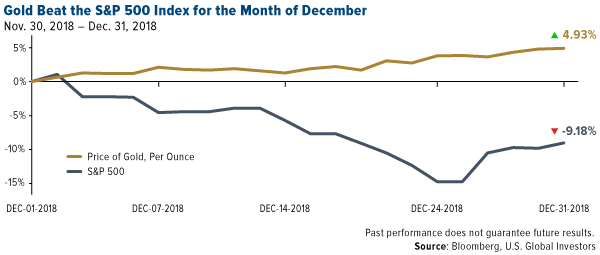
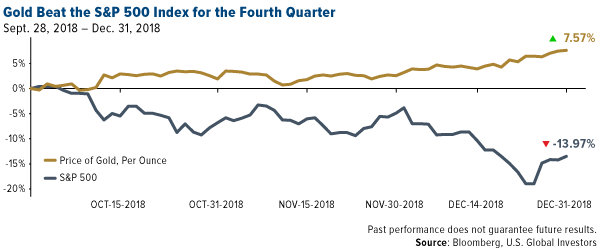
The yellow metal, after all, has historically had a strong negative correlation with the market. I’m pleased to report that this inverse relationship held firm in 2018, proving again that investors continue to see gold as a valuable asset in times of financial instability. As you can see in the charts below, gold beat the S&P 500 Index for the month of December, the fourth quarter and the year.
With stocks down, gold’s outperformance shouldn’t come as such a shock to most readers.
What might surprise you is that the precious metal has also beaten the market for the century, 345.39 percent versus 70.62 percent, since December 31, 1999.
This tells me that, even though gold is still down from its 2011 peak, investors continue to value it as an attractive store of value.
Strong Gold Investment on Heightened Stock Volatility
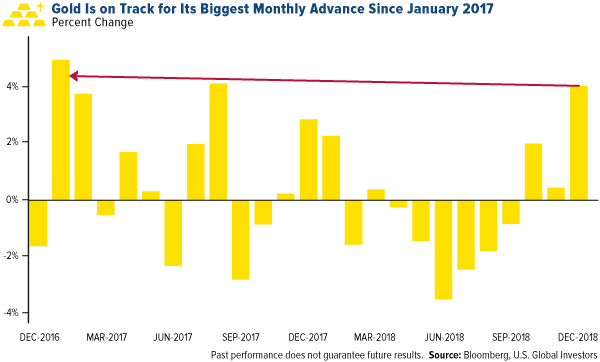
Indeed, gold bulls added substantial positions to ETFs backed by bullion in December as the metal headed for its biggest monthly advance in two years. Gold-backed ETF holdings surged by more than 100 tons between October and December, helping to boost prices even further. During last Thursday’s trading session, ETFs bought 662,080 troy ounces of gold, the biggest one-day increase in at least 12 months, according to Bloomberg.
Quincy Krosby, chief market strategist at Prudential Financial, explains why this buying is no fluke. Speaking to Bloomberg, she said that “the market is questioning whether the [Federal Reserve] is making a policy mistake, and that could not only lead to slower growth, but perhaps to a recession.” Krosby went on to say that when you see this heavy selling in equities, “it’s indicative of fear, and gold [historically] becomes [favored as a relatively] safe-haven allocation.”
Gold Miners Ended the Year on a High Note
It wasn’t just bullion that had a good quarter. Precious metal miners, as measured by the FTSE Gold Mines Index, gained a remarkable 15.85 percent in the three months ended December 31. Among the leaders in 2018 were Nevsun Resources, up 106 percent for the 12-month period; Kirkland Lake Gold, up 81 percent; SSR Mining, up 45 percent; and North American Palladium, up 38 percent.
So should you consider exposure to the gold market?
I believe a good way to participate is with our gold fund, the Gold and Precious Metals Fund (USERX), which provides access to producers with well-established mines. I’m thrilled to tell you that the fund, managed by precious metals expert Ralph Aldis, holds a four-star rating overall from Morningstar as of September 30, 2018. USERX also holds a four-star rating for the three-year, five-year and 10-year periods.
Curious to learn more? Explore the Gold and Precious Metals Fund (USERX) overview page by clicking here!
Please consider carefully a fund’s investment objectives, risks, charges and expenses. For this and other important information, obtain a fund prospectus by visiting www.usfunds.com or by calling 1-800-US-FUNDS (1-800-873-8637). Read it carefully before investing. Foreside Fund Services, LLC, Distributor. U.S. Global Investors is the investment adviser.
Gold, precious metals, and precious minerals funds may be susceptible to adverse economic, political or regulatory developments due to concentrating in a single theme. The prices of gold, precious metals, and precious minerals are subject to substantial price fluctuations over short periods of time and may be affected by unpredicted international monetary and political policies. We suggest investing no more than 5% to 10% of your portfolio in these sectors.
![]()
Morningstar ratings based on risk-adjusted return and number of funds
Category: Equity Precious Metals
Through: 9/30/2018
Morningstar Ratings are based on risk-adjusted return. The Morningstar Rating for a fund is derived from a weighted-average of the performance figures associated with its three-, five- and ten-year Morningstar Rating metrics. Past performance does not guarantee future results. For each fund with at least a three-year history, Morningstar calculates a Morningstar Rating based on a Morningstar Risk-Adjusted Return measure that accounts for variation in a fund’s monthly performance (including the effects of sales charges, loads, and redemption fees), placing more emphasis on downward variations and rewarding consistent performance. The top 10% of funds in each category receive 5 stars, the next 22.5% receive 4 stars, the next 35% receive 3 stars, the next 22.5% receive 2 stars and the bottom 10% receive 1 star. (Each share class is counted as a fraction of one fund within this scale and rated separately, which may cause slight variations in the distribution percentages.)
The S&P 500 Stock Index is a widely recognized capitalization-weighted index of 500 common stock prices in U.S. companies. The FTSE Gold Mines Index encompasses all gold mining companies that have a sustainable and attributable gold production of at least 300,000 ounces a year, and that derive 75% or more of their revenue from mined gold.
Fund portfolios are actively managed, and holdings may change daily. Holdings are reported as of the most recent quarter-end. Holdings by region in the Gold and Precious Metals Fund as a percentage of net assets as of 9/30/2018: Nevsun Resources Ltd. 0.82%, Kirkland Lake Gold Ltd. 0.00%, SSR Mining Inc. 1.07%, North American Palladium Ltd. 0.00%.
All opinions expressed and data provided are subject to change without notice. Some of these opinions may not be appropriate to every investor.
This post was originally published at Frank Talk.
Copyright © U.S. Global Investors

