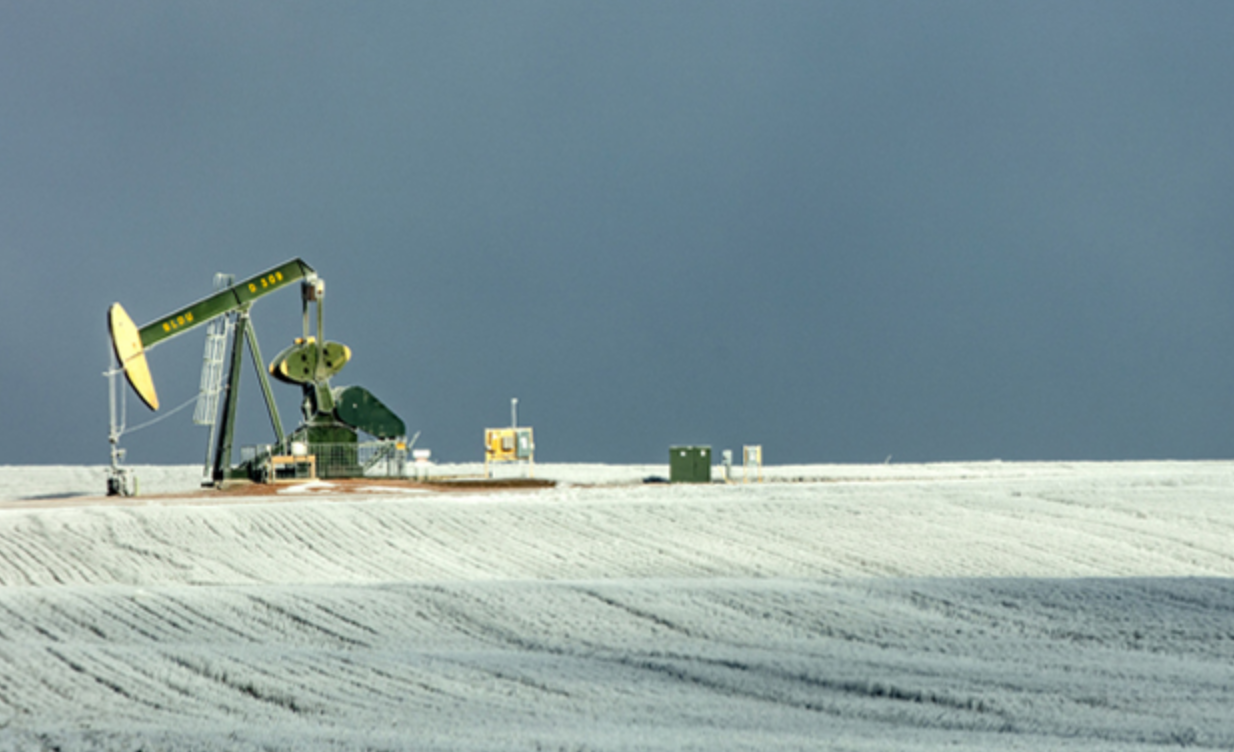
It seems counter intuitive that oil prices have been in a free fall while the Colorado mountains are enjoying several feet of snow and Boston gets its coldest Thanksgiving in a century. But current prices are less about the weather and more about global supplies and geopolitics. OPEC will be having a couple of big meetings over the next two weeks to decide on how they are going to respond to the overproduction caused by the Iran sanction waivers and the enormous production in the U.S. shale basins. Will the next price on crude oil be at $70 or $30?
It is also a big week for China and U.S. trade talks at the G-20 meetings. Will either side back down and engage in productive discussions, or will this be the start of a longer trade war? Economic and financial market impacts are being felt on both sides of the Pacific Ocean. The markets want a deal, as do farmers and anyone who imports or exports from China. Across the eastern ocean, Brexit negotiations continue with Parliament to try and find votes for the approved EU/UK deal. As of now, it doesn’t appear to have enough support but let the hog trading begin.
The holiday shortened markets last week produced more of the same. Lower prices in equities, widening credit spreads and safety buying in Treasuries and cash instruments. At the same time, economic data disappointed with big weakness seen in the Q3 durable goods data. The market has five weeks left until year end. Softer data could be good for risk if it gets the Fed to slow down their rate hike talk. There is the potential for a bounce in equities if there are few meaningful negative surprises from corporate preannouncements or the credit markets. Clarity on global trade and energy prices this week will definitely help set the tone for whether or not investors want to be long or short risky assets for 2019. So pour yourself a yerba mate or malbec and let’s see what Argentina has in store for our portfolios this week.
To receive this weekly briefing directly to your inbox, subscribe now.
Agreed. Don’t catch falling knives…
What is going on? Surging Saudi oil production. Ever increasing U.S. shale production. Iranian sanction waivers. OPEC cheating. Assassination of Khashoggi. Trump tweeting to MBS. Global economic slowdown. Oh, and electric scooters.

(@kkernttb)
Saudi oil production at all-time highs…
Saudi Arabia is pumping more crude than at any time since its first barrel was extracted 80 years ago, responding to pressure from U.S. President Donald Trump to keep driving oil prices lower.
Saudi daily output reached 11.2 million barrels a day, from 10.8-10.9 million barrels earlier this month, according to a person familiar with the matter, who asked not to be identified because the data is private. While Brent crude, the global benchmark, already tumbled as much as 33 percent since early October, Trump a week ago tweeted: “Thank you to Saudi Arabia, but let’s go lower!”

And U.S. production is soon to pass Saudi production…
U.S. drillers are completing budgets for next year, when they are expected to propel American oil production to about 12 million barrels a day, according to the EIA. So far, companies haven’t pulled back on 2019 capital-spending plans, but many had been operating on an assumption that oil prices were unlikely to drop below $60 a barrel.
(WSJ)

(WSJ/DailyShot)
High-Yield Energy spreads move inversely to energy prices…
In 2014, Crude Oil fell from $100 to $30. Today’s move is only $80 to $50 but is still having an impact in the credit markets. U.S. oil companies are healthier and better prepared than four years ago when OPEC raised production levels. It will be an interesting couple of weeks of meetings to see what OPEC has planned this time around.
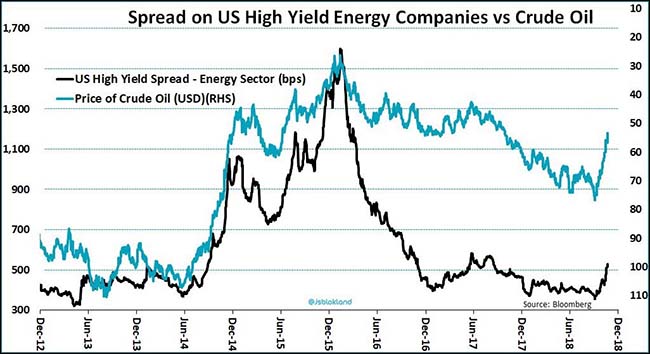
(@jsblokland)
One more time: Higher oil prices are better for the U.S. than lower oil prices…
Gasoline prices to consumers are now less important than oil industry jobs and production royalties. If anyone could please hand deliver the above charts to anyone advising the White House on economics or energy policy, it would be great to clear up this significant misunderstanding.

The Asian liquidity shrink should cause concern…
Leave aside Japan, where the printing presses are still pumping out yen. In rest of the region, central banks’ supply of currency plus bank reserves has shrunk 7 percent in real terms since the dollar began surging in April. This is the steepest contraction in base money since the 11 percent fall between January and October of 2008.
Bank of America Merrill Lynch equity strategists recently looked at a similar measure of money supply for the world and asked if the squeeze was a harbinger of something ugly. The inflation-adjusted global monetary base has shrunk just five times since 1980, the analysts noted: in 1982, 1990, 1998, 2001 and 2006. All five episodes either preceded or coincided with global slowdowns.
The Asian tightness is easily explained as the unwinding of the capital flows that came rushing in after Western central banks cut interest rates to zero and expanded their balance sheets — first to deal with the 2008 credit contagion and then to try to put nominal GDP on its pre-crisis path. Now a stronger dollar and higher U.S. interest rates are pulling funds back.

Banco Santander illustrates the departure of Central Bank liquidity perfectly…
@TayTayLLP: Holy greatness! Santander, in their 2019 credit outlook perfectly captures how credit investors feel going into the new yr. This front matter of their report captures my, & other credit investors’ current views.

Central Banks aren’t the only ones removing liquidity…

Speaking of credit risk…

Another more domestic credit risk…
Better check on your Regional Bank credit card portfolio data. I was unaware of this spike. But as we know with deteriorating credit, it can happen quickly.

The big economic number last week was the decline in U.S. durable goods…
A decline in orders for long-lasting factory goods in October suggests business investment is softening, a discouraging sign for economic growth in the fourth quarter.
Business investment, a strong spot for the economy in the first half of the year, moderated in the third quarter and appears to have started the fourth quarter on a weak footing. Worries about a trade war, a drop in oil prices hitting energy investment and a stronger dollar making U.S.-made goods pricier for foreign buyers all appear to be offsetting tailwinds from last year’s tax overhaul and strong corporate profits.
Orders for durable goods—products designed to last at least three years, such as computers and machinery—decreased 4.4% from the prior month in October, the Commerce Department said Wednesday. That was the biggest monthly decline in new orders since July 2017, and it was much steeper than the 2.6% drop Wall Street analysts had expected.
(WSJ)
Bond yields have retreated…
All the poor economic news and weaker prices of equity and credit have given a bid to bonds in the last month. But with the national debt up $1.8 trillion in two years and a continued need to fund an even larger current deficit, how long before long interest rates start rising again?

A positive for anyone betting on a U.S. recession…
The U.S. yield curves are again flattening.

Good news and bad news…
Odds the U.S. will fall into a recession in the next year stands at 15 percent, according to Bloomberg’s U.S. Recession Probability Forecast index. While they see the economy losing a bit of speed next year and in 2020, the median estimate of economists calls for 2.6 percent economic growth in the next 12 months.
Economists haven’t always done a great job predicting contractions. A 2014 study by the International Monetary Fund’s Prakash Loungani found that not one of 49 recessions suffered around the world in 2009 had been predicted by the consensus of economists a year earlier. Loungani previously reported that only two of the 60 recessions of the 1990s had been anticipated a year in advance.

BofA/Merrill Lynch is increasing its caution into 2019…

(@carlquintanilla)
Morgan Stanley’s 2019 outlook is also cautious on risk taking…
But sees Emerging Markets and Value outperforming. Both of those assets have underperformed significantly the last decade.

(Morgan Stanley)

(@carlquintanilla)
Some Emerging Market equities are turning the corner…
@HumbleStudent: EM equities turning up vs. $ACWI in all regions except #China $EEM

Again, don’t catch the falling knife. Time for Mega Caps to pause…
@DavidSchawel: Post tech selloff, the top 10 stocks as a share of S&P 500 market cap has moved closer to the LT avg

GM decides to layoff 15% of its workforce until the skies clear…
General Motors Co. plans to make significant cuts to its North American workforce, cutting more than 8,000 salaried employees in the region and ending production at three factories, potentially affecting another 6,000 assembly line jobs…
GM had about 180,000 employees world-wide at the end of 2017, including approximately 103,000 in the U.S., according to a regulatory filing…
Despite two straight years of record operation profit and a historically strong run of U.S. vehicle sales, GM said it is seeking to tighten its belt while times are good. Chief Executive Mary Barra said the company wants to be more efficient in its core business of engineering and building cars, while plowing more money into potential game-changing innovations like electric and self-driving cars.
(WSJ)
The markets get worse for U.S. farmers…
Now winter wheat is trading at 52-week lows. Good news for gluten eaters.

Craziest stat of the week…
Earth just had its second-warmest October on record, according to NOAA data released Tuesday. NASA reported the same finding last week. The finding extends the planet’s hot streak to 406 straight months with temperatures above the 20th century average. Meanwhile, the last colder-than-average month occurred in February 1985. This means that no one under the age of 32 has ever experienced a cooler-than-average month on this planet.
(Axios)
Best Black Friday advertisement…

(@gabykirschner)