by Liz Ann Sonders, Senior Vice President, Chief Investment Strategist, Charles Schwab and Co.
Key Points
- Leading economic indicators are showing no stress on the surface; but it’s what’s beneath the surface that often matters more to the stock market.
- Global leading indicators are already signaling heightened stress and rising risk of recession.
- The spread between “soft” and “hard” economic data is eye-opening.
Regular readers likely know two things about me. I keep a close eye on leading economic indicators and focus at least as much on trends as levels. It’s why one of my long-held mottos is “better or worse matters more than good or bad.” It’s human nature to focus on levels—when the economic data is strong, we feel better about both the economy and the stock market. The rub is that the stock market has a fairly uncanny ability to sniff out inflection points in the economy. It’s why we often borrow a phrase from Walter Gretsky to his hockey-playing son Wayne: the stock market tends to “skate to where the puck is going, not where it has been.”
Leading Economic Indicators saying all clear?
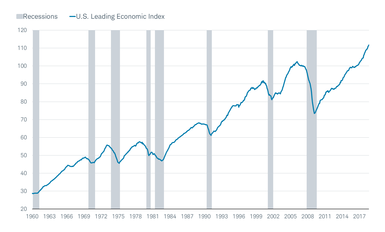
In terms of the leading indicators, the most widely-followed is the Leading Economic Index (Leading Economic Indicators) put out monthly by The Conference Board. As you can see in the chart below, there is no sign of deterioration in the level of the Leading Economic Indicators; having been in an accelerating trend for much of the period since coming out of the financial crisis-related recession. Historically, it was an average 13 months from Leading Economic Indicators peaks to recession starts. On that basis, it appears the runway remains reasonably long between now and the next recession.
U.S. Leading Economic Indicators Still Surging
Source: Charles Schwab, FactSet, National Bureau of Economic Research (NBER), The Conference Board, as of September 30, 2018.
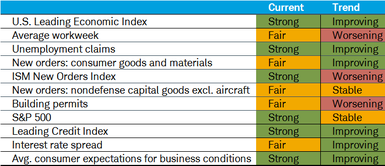
But it’s important to keep an eye on what’s under the Leading Economic Indicators’s hood from a trend perspective. That’s why I track both the level and trend of the 10 sub-indicators, seen in the table below. Although it’s not by any means a sea of red, there are some notable weaker trends among the leading indicators; including the average workweek, ISM new orders and building permits.
Source: Charles Schwab, FactSet, The Conference Board, as of September 30, 2018.
Leading Economic Indicators good at “forecasting” economy but not stock market
I’m often asked about the predictive ability of the Leading Economic Indicators. Looking at subsequent real gross domestic product growth (GDP), the correlation between the Leading Economic Indicators and forward one-year GDP is a high .83 (remember 1.0 is a perfect correlation). However, the same cannot be said for the correlation between the Leading Economic Indicators and forward one-year S & P 500 returns. That correlation is actually slightly negative at -.10, even though the stock market is one of the sub-indicators in the Leading Economic Indicators.
This is why we can’t assume that even if the Leading Economic Indicators isn’t signaling an imminent recession that stocks will be immune to a weakening in some of the underlying indicators. Yes, the Leading Economic Indicators has turned down before every recession since 1969; there have been 13 serious corrections and/or bear markets during periods when the Leading Economic Indicators was still rising.
Global Leading Economic Indicators rolling over again
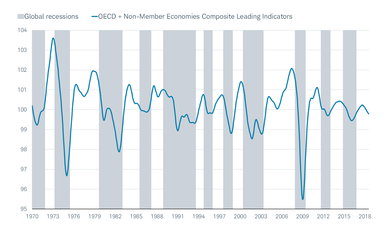
Global trends matter as well, and the weakness—and lower lows and lower highs—seen in global leading indicators is also worth watching. Most peaks in the OECD + Non-Member Economies Composite Leading Indicator have immediately preceded global recessions (which occur more frequently than U.S. recessions, as you can see in the chart below).
OECD Leading Indicator Weaker
Source: Charles Schwab, FactSet, Organisation for Economic Co-operation and Development, as of August 31, 2018.
There are other signs of potential economic inflection points, with the list below representing a hodge-podge of sorts:
Labor market data (as of September, unless otherwise specified)
- Manufacturing hours have been down two months in row.
- Overtime hours are being reduced.
- Aggregate hours worked were down to 0.7% from 3.0% mid-year.
- Those working part-time for economic reasons jumped 6% to 263k.
- Self-employed persons were up 138k (+18.6% at an annual rate)—a counter-cyclical indicator.
- Employment of prime-age males (25-54) fell 30k.
- Household survey employment (from which the unemployment rate is calculated) dropped 272k.
- The share of long-term unemployed moved up to 22.9% from 21.5%.
- The average duration of unemployment moved up to 24 weeks from 22.6 weeks.
- The net share of companies hiring over past three months fell 1% from 5%.
- The pool of available labor fell 422k (and sits at a 12 year low).
- Payrolls for those with a high school diploma or some college jumped 426k, while for those with at least a college degree fell 328k.
- Over the past six months, 70% of payroll gains have been from the pool with a high school education or less.
- Since May, more than 100% of job growth has come from either high school dropouts or high school only graduates.
- Job openings are now 902k greater than unemployed and available people; which represents a late-cycle constraint on growth if orders can’t get filled.
Economy/earnings (through September, unless otherwise specified)
- Key housing data has rolled over, including pending and existing home sales, housing starts and building permits (see above).
- Manufacturing ISM new orders were weaker in October, with survey respondents “again overwhelmingly concerned about tariff-related activity, including how reciprocal tariffs will impact company revenue and current manufacturing locations.”
- Auto sales have weakened with several major auto makers reporting steep double-digit declines in September and/or the third quarter—Ford recently announced it’s considering laying off 12% of its global workforce
- Philly Fed’s new and unfilled orders fell in October, while 56% of companies surveyed saying they’re operating at 80% capacity utilization (or higher) vs. 42% at this time last year; which doesn’t bode well for production in the months ahead in our view.
- Forward-looking earnings per share estimates have stopped rising with corporate guidance now biased to the downside according to ThomsonReuters.
- Corporate insider selling has picked up sharply according to TrimTabs Investment Research.
- The “gravy train” of stock buybacks; financed with low-cost borrowing and fueling stock market gains for years, may be at risk as interest rates continue to move up.
The above doesn’t represent an exhaustive list; nor does it suggest that there aren’t ample positive offsets. But when some key underlying trends begin to deteriorate, it’s time to consider the risk of a broader rolling over of economic growth.
Soft and hard at odds
I will conclude with another type of inflection point worth pondering. I’ve written much over the past couple of years about the wide spread between “soft” (survey- and confidence-based) economic data and “hard” (actual quantifiable) economic data. Somewhat courtesy of the results of the 2016 presidential election and the ushering in of business-friendly policies, including tax and regulatory reform, animal spirits have remained fairly lofty, which feed into the soft data.
As you can see in the chart below, the soft data is accelerating again after retreating from a pair of extremely high readings in early- and late-2017. However, notice the deterioration of the hard data—the drop since the January peak is the most significant since the financial crisis days and has now resulted in a yawning gap between soft and hard.
Soft vs. Hard Data Gap Widening
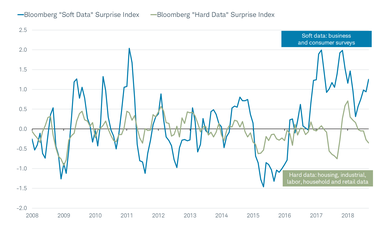
Source: Charles Schwab, Bloomberg, as of September 30, 2018.
In sum, there has been much to cheer about the strength in the economic data, but investors need to be mindful of some budding risks. Not only have some of the economy’s key leading indicators rolled over, the gap between what companies and consumers are “saying” is widening relative to what companies and consumers are “doing.” There may remain some time before recession risk becomes elevated, but with monetary policy tightening and tariff concerns persistent and more quantifiable, it behooves all investors to be mindful of risks and consider applying a heightened level of discipline around portfolio construction.


