by Frank Holmes, CIO, CEO, U.S. Global Investors
In case you couldn’t tell from the ubiquitous political ads and yard signs, midterm elections are right around the corner. Historically, volatility has increased and markets have dipped leading up to midterms on uncertainty, but afterward they’ve outperformed.
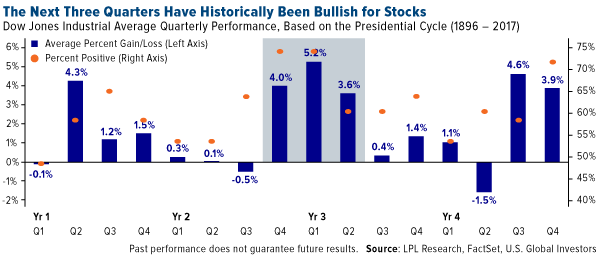
Of especially good news is that we’re entering the three most bullish quarters in the four-year presidential cycle, according to LPL Financial Research. The fourth quarter of the president’s second year in office, which begins next month, and the first and second quarters of the third year have collectively been the best nine months for returns, based on 120 years of data.
It makes sense why this has been the case. Following midterms, the president has been motivated to “boost the economy with pro-growth policies ahead of the election in year four,” writes LPL Financial.
Government Policy Is a Precursor to Change
Should Republicans manage to hold on to both the House and Senate—which Wells Fargo analysts Craig Holke and Paul Christopher estimate has a 30 percent probability—it’s likely they’ll try to pass “Tax Reform 2.0,” with an emphasis on the individual tax side. We can also probably expect to see additional financial deregulation.
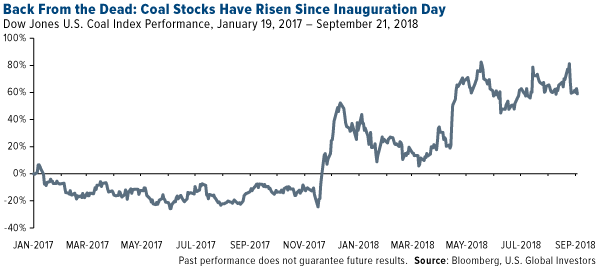
Cornerstone Macro is in agreement, writing that “the better Republicans do in the election, the more confidence investors will have that [President Donald] Trump could be reelected and the business-friendly regulatory practices will remain in place.” A GOP Congress, the research firm adds, would be supportive of banks and energy, specifically oil, gas and coal. Since Trump’s inauguration, the Dow Jones U.S. Coal Index has climbed nearly 60 percent, double the S&P 500’s performance.
The more likely outcome, according to Holke and Christopher, is a divided Congress, with Democrats taking control of the House. In such a scenario, financial deregulation would slow, but Trump, who’s pushed hard for aggressive infrastructure spending, might find the support he needs for a bill from Democrats. This would help increase demand for commodities and raw materials, but “additional stimulus in an economy already near capacity may result in higher inflation, negatively affecting fixed income,” Holke and Christopher write.
On the other hand, higher inflation has historically meant higher gold prices. After climbing for 12 months, year-over-year change in consumer prices cooled in August to 2.7 percent, from July’s 2.9 percent.
Government policy is a precursor to change, as I often say. It’s not the party that matters but the policies, and there are ways for investors to make money however the midterms unfold.
Money Managers and Banks Are Adding Safe Havens at a Faster Pace
With the bull run now the longest in U.S. stock market history, there’s a lot of talk and speculation about when the next major pullback will happen. I’ve discussed a number of possible catalysts with you already, from record levels of global debt to the flattening yield curve. Recently I shared with you that Goldman’s bull/bear indicator hit its highest level in nearly 50 years.
Even as markets closed at fresh all-time highs, essentially ignoring the intensifying U.S.-China trade war, Bank of America Merrill Lynch (BofAML) called the bull run “dead” last week, due to slowing global economic growth and the end of monetary stimulus. “The Fed is now in the midst of a tightening cycle, ignoring structural deflation, focusing on cyclical inflation,” writes BofAML chief strategist Michal Hartnett.
Against this backdrop, a growing number of money managers hold a dim view of continued economic growth. September’s Bank of America Merrill Lynch Fund Manager Survey found that a net 24 percent of fund managers believe global growth will slow over the next 12 months. That’s the highest percentage of managers with such a view since December 2011, the height of the European debt crisis. Reasons given for this bearishness are the U.S.-China trade tensions and, again, the end of central bank accommodation.
Fund managers are raising their cash levels, Hartnett says, as well as their exposure to fixed income, which has traditionally been used as a safe haven in times of uncertainty. In July, the most recent month of Morningstar data, bond funds attracted the greatest amount of any asset class in the U.S., with taxable and municipal bonds seeing a collective $28.5 billion in inflows. U.S. equity funds, meanwhile, collected a little under $3 billion, and in fact have seen $11 billion in outflows in the 12 months through July 31.
Getting even more specific, U.S. actively-managed ultrashort bond funds were the biggest winner, attracting over $6 billion in July, according to Morningstar.
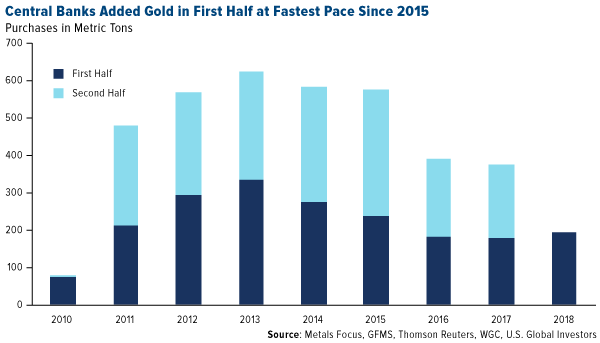
Gold demand among central banks has also accelerated this year. According to the World Gold Council (WGC), banks added a net 193.3 metric tons of gold to their reserves in the first half of the year, an 8 percent increase from 2017. This was the most purchased in the first six months since 2015.
The Next Crisis Could Be Triggered by Passive Indexing

One of the biggest risks right now, I believe, is the explosion in passive, “dumb beta” indexing. Trillions of dollars have poured into products that track indices built not on fundamental factors like revenue, cash flow and return on invested capital (ROIC), but on simple market capitalization. A piling on effect has occurred, whereby multibillion-dollar funds are buying more and more of the most expensive stocks. This has resulted in overinflated valuations.
The big risk is when these funds rebalance, which could happen as early as the beginning of next year. Last year, junior mining stocks got crushed after the VanEck Vectors Junior Gold Miners ETF (GDXJ) restructured its portfolio. Imagine what could happen if all passive index funds did the same simultaneously.
Last week I wrote more in depth about the risks passive indexing poses. If you didn’t get a chance to read it, I invite you to do so by clicking here.
*****
All opinions expressed and data provided are subject to change without notice. Some of these opinions may not be appropriate to every investor. By clicking the link(s) above, you will be directed to a third-party website(s). U.S. Global Investors does not endorse all information supplied by this/these website(s) and is not responsible for its/their content.
The Dow Jones Industrial Average (DJIA), or simply the Dow, is a stock market index that shows how 30 large, publicly owned companies based in the United States have traded during a standard trading session in the stock market. The S&P 500 index is a basket of 500 of the largest U.S. stocks, weighted by market capitalization. The Dow Jones U.S. Coal index is a subindex of the Dow Jones U.S. Indices and seeks to track all stocks classified in the coal subsector (1771) of the Dow Jones Sector Classification Standard traded on major U.S. stock exchanges.
Cash flow is the total amount of money being transferred into and out of a business, especially as affecting liquidity. Return on invested capital (ROIC) is a calculation used to assess a company's efficiency at allocating the capital under its control to profitable investments. Beta is a measure of the volatility, or systematic risk, of a security or a portfolio in comparison to the market as a whole.
Holdings may change daily. Holdings are reported as of the most recent quarter-end. None of the securities mentioned in the article were held by any accounts managed by U.S. Global Investors as of 6/30/2018.
This post was originally published at Frank Talk.
Copyright © U.S. Global Investors


