Now that Labour Day has passed and summer holidays are over, investors have returned to work and are starting to look ahead to the final third of the year. Historically, on a seasonal basis, mid-August to mid-October has been the weakest and most volatile time of the year for stocks, It’s about six weeks to the next earnings season so corporate news has gone quiet but there are a number of economic developments that could move the markets.
A big week for economic data is underway. US Manufacturing PMI was better than expected, Construction spending disappointed and nonfarm payrolls are due Friday. In Canada, the Bank of Canada held interest rates as expected, the trade deficit was not as bad as feared and employment numbers are due Friday.
Emerging markets remain unsettled with Argentina and South Africa coming under fire along with Turkey. In the past, problems in emerging markets have been known to rattle world stock markets for periods of a few weeks to a few months. Adding to the current uncertainty, US trade talks with Canada and China have been going nowhere while midterm elections add a layer of complexity to the situation. A rising US Dollar has also put a headwind in front of stocks. The next two months could see markets unsettled by a lot of external noise but for now underlying positive economic and market momentum remains intact.
In this week’s issue of Equity Leaders Weekly we look at seasonality in the energy sector. Weather plays a significant role in energy markets with different types of fuel in demand at different times of the year. The Labour Day weekend was the end of Summer Driving Season, the peak time of the year for Gasoline demand. As we move into September, investors often start to look ahead to Winter Heating Season, the peak time of the year for Natural Gas and Heating Oil demand.
Investors should also note that we are also moving into the heart of hurricane season, which has the potential to spark short term spikes in oil and natural gas prices. As we saw this week, however, storm related moves (prices can go up if it looks like Gulf of Mexico production may be curtailed) can come and go quite quickly.
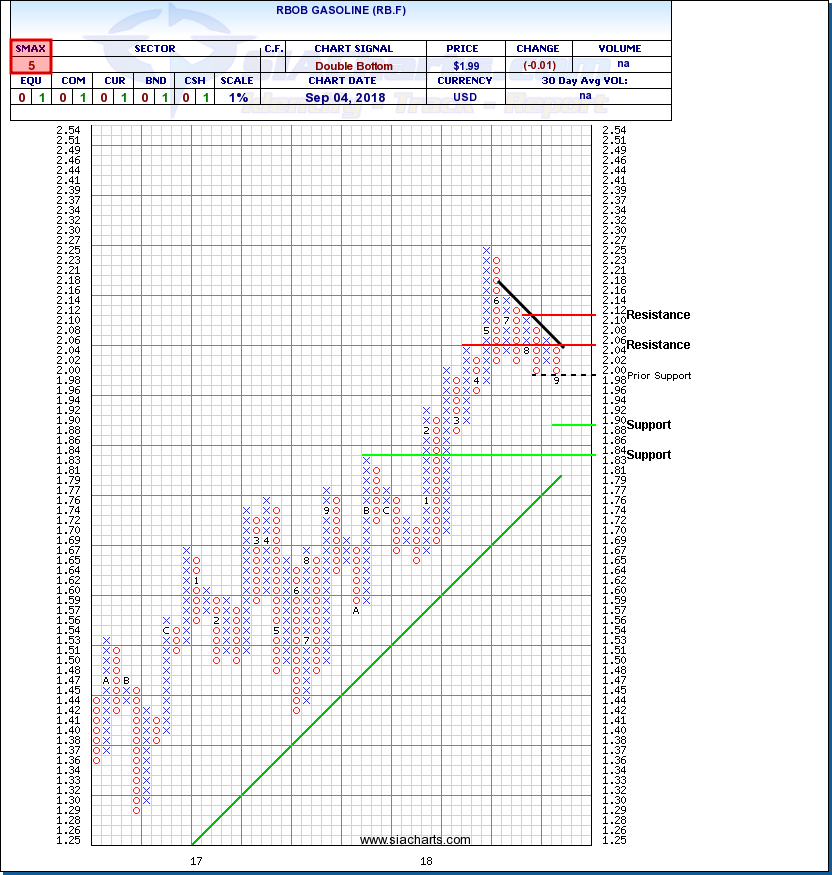
Gasoline Continuous Contract (RB.F)
An uptrend in gasoline prices peaked back in the spring near $2.27 per gallon. Over the summer, a series of lower highs has indicated accumulation shifting to distribution. This week, gasoline has broken down below $2.00, a big psychological breach of support signalling the start of a seasonal downswing.
Initial downside support may appear near $1.88 measured from a recently completed Double Bottom pattern, followed by a previous high near $1.83. Gasoline’s underlying uptrend remains intact above $1.80/ Initial resistance on a rebound could appear near the $2.00 round number then $2.06 and $2.12. With a bearish SMAX score of 5, RB.F is exhibiting weakness against the asset classes.
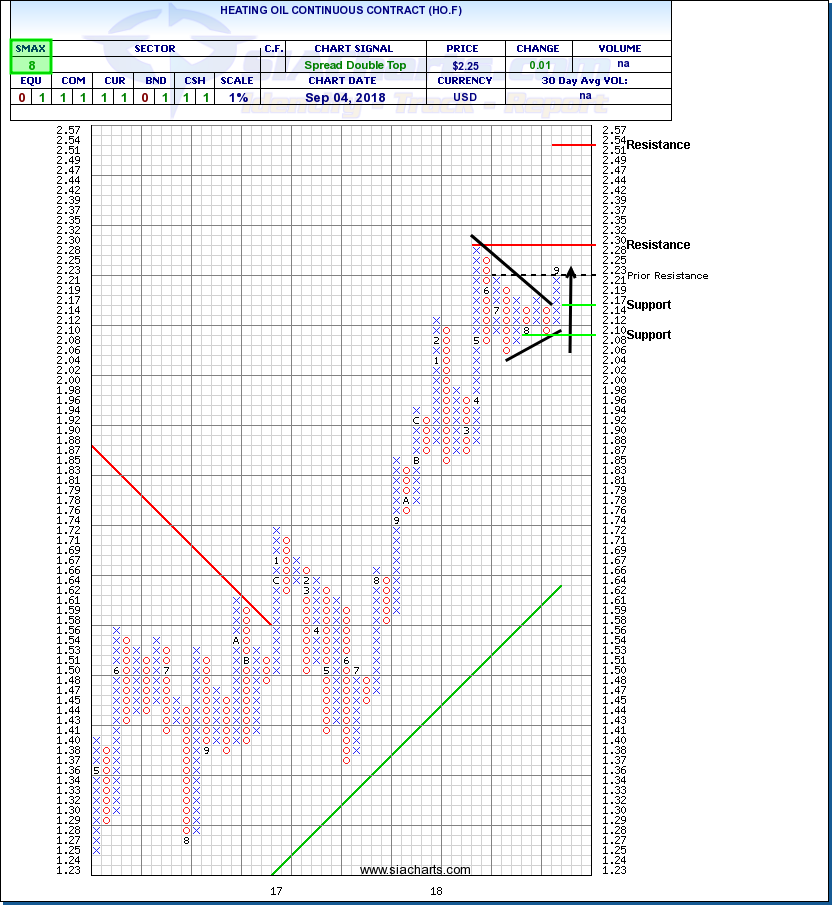
Heating Oil Continuous Contract (HO.F)
Heating Oil has been in a bullish trend for over a year. After peaking in May near $2.30, a seasonal correction took the price back toward $2.06 but holding above the $2.00 round number indicated that the underlying uptrend remained intact.
Heating oil spent its low demand summer season consolidating between $2.06 and $2.20, well above the $1.36 to $1.66 range it spent the summer of 2017 in. Even with record breaking heat in some areas, with autumn approaching, investors have started to look ahead to heating season.
SIACharts.com specifically represents that it does not give investment advice or advocate the purchase or sale of any security or investment. None of the information contained in this website or document constitutes an offer to sell or the solicitation of an offer to buy any security or other investment or an offer to provide investment services of any kind. Neither SIACharts.com (FundCharts Inc.) nor its third party content providers shall be liable for any errors, inaccuracies or delays in content, or for any actions taken in reliance thereon.


